![Marks] Gestion Twer Problem Solving Sepa Corporation Comparative Balance Sheet As at June 10, 2016 and 2017 Millions of Dolla](http://img.homeworklib.com/questions/fa559110-71b9-11ea-badd-db9258e36986.png?x-oss-process=image/resize,w_560)
Homework Answers
Answer:
Performance evaluation:
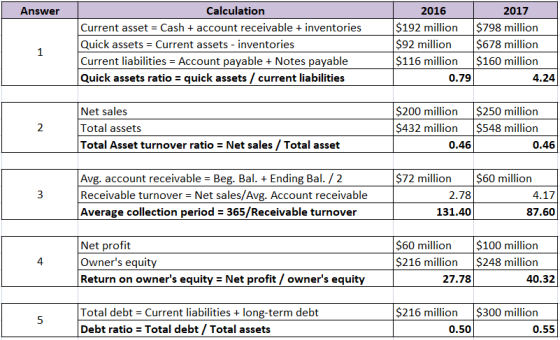
(i) Quick assets ratio:- This ratio indicates the firm's ability to meet immediate liabilities. The ideal ratio is 1:1. For year 2016, it is less than 1 which indicates firm's inability to meet all immediate liabilities as and when they become due.
(ii) Total assets turnover ratio:- This ratio indicates the firm's ability to generate sales per dollar of total assets. The higher the ratio, the better it is for the firm. For both the years, the ratio is same. So firm has not been able to grow sales in 2017 when it comes to generation of sales per dollar of total assets.
(iii) Average collection period:- This indicates on average how long a firm have to wait to make collection of account receivable. It can be noticed that the firm has been able to reduce the waiting period from 131.40 days to 87.60 days in 2017.
(iv) Return on owner's equity:- This ratio indicates the firm's profitability on the owner's equity invested in the business. The higher the ratio, the better it is for the firm. It can be noticed that the firm has been able to increase this ratio27.78% to 40.32% in 2017.
(v) Debt ratio:- The debt ratio shows a company’s ability to pay off its liabilities with its assets. It measures the financial leverage of a company. It can be noticed that in year 2017 it's degree of leverage has increased which may be riskier for the company.
Add Answer to:
Marks] Gestion Twer Problem Solving Sepa Corporation Comparative Balance Sheet As at June 10, 2016 and...
LO3 restion Fwoc Problem Solving (S Marks) Sepma Corporation Comparative Balance Sheet As at June 30, 2016 and 2037...
 LO3 restion Fwoc Problem Solving (S Marks) Sepma Corporation Comparative Balance Sheet As at June 30, 2016 and 2037 (Millions of Dollars) Assets Cash Accounts Receivable Inventory 2017 $630 2016 $ 20 72 48 100 120 Gross fixed assets Accumulated depreciation Net fixed assets 480 160 400 160 240 320 Total assets 432 548 Uiabilities and owners 'equilty 128 Accounts payable 80 Notes payable 36- 32. Long term debt Common stock Retained earnings Total liabilities and owners 'equity 100 132...
Just Dew It Corporation reports the following balance sheet information for 2017 and 2018 ook $...
 Just Dew It Corporation reports the following balance sheet information for 2017 and 2018 ook $ 73,750 $ 63,750 rences JUST DEW IT CORPORATION 2017 and 2018 Balance Sheets Assets Liabilities and Owners' Equity 2017 2018 2017 2018 Current assets Current liabilities $ 10,500 $10.450 Cash Accounts payable 28,250 Accounts receivable 28,600 Notes payable 50,000 49,750 $ 123,750 $ 113,500 Inventory 64,300 63,500 Total $ 103,050 $ 102,550 $ 63,600 $ 64,600 Total Long-term debt Owners' equity Common stock and...
Calculate ratios. (10 4,5,6) AP E18-17 Rinker Corporation's comparative balance sheet is presented below. RINKER CORPORATION...
 Calculate ratios. (10 4,5,6) AP E18-17 Rinker Corporation's comparative balance sheet is presented below. RINKER CORPORATION Balance Sheet December 31 2016 Cash Accounts receivable Inventory Land Buildings Accumulated depreciation--buildings Total Accounts payable Common shares Retained earnings Total 2017 $ 5,300 21,200 9,000 20,000 70,000 (15,000) $110,500 S 3,700 23,400 7,000 26,000 70,000 (10,000) $120,100 $ 10,370 75,000 25,130 $110,500 $ 31,100 69,000 20,000 $120,100 Rinker's 2017 income statement included net sales of $120,000, cost of goods sold of S70,000, and...
Just Dew It Corporation reports the following balance sheet information for 2017 and 2018. JUST DEW...
Just Dew It Corporation reports the following balance sheet information for 2017 and 2018. JUST DEW IT CORPORATION 2017 and 2018 Balance Sheets Assets Liabilities and Owners' Equity 2017 2018 2017 2018 Current assets Current liabilities Cash $ 10,150 $ 10,300 Accounts payable $ 70,250 $ 61,250 Accounts receivable 27,700 28,950 Notes payable 47,250 46,750 Inventory 62,300 64,800 Total $ 117,500 $ 108,000 Total $ 100,150 $...
15 and 16 PART 2 Understanding Financial Statements and Cash Flow 2016 BETHESDA MINING COMPANY Balance...
 15 and 16
PART 2 Understanding Financial Statements and Cash Flow 2016 BETHESDA MINING COMPANY Balance Sheets as of December 31, 2015 and 2016 2015 2016 2015 Assets Liabilities and Owners' Equity Current assets Cash Current liabilities $ 19,256 $ 21,946 Accounts receivable Accounts payable $171,531 46,396 54,486 Inventory Notes payable 79,218 109,626 129.253 Total $250.749 Total $175,278 $205,685 Long-term debt $255,000 Owners' equity Common stock and paid-in surplus $160,000 Fixed assets Accumulated retained earnings 214,915 Net plant and equipment...
15 and 16
PART 2 Understanding Financial Statements and Cash Flow 2016 BETHESDA MINING COMPANY Balance Sheets as of December 31, 2015 and 2016 2015 2016 2015 Assets Liabilities and Owners' Equity Current assets Cash Current liabilities $ 19,256 $ 21,946 Accounts receivable Accounts payable $171,531 46,396 54,486 Inventory Notes payable 79,218 109,626 129.253 Total $250.749 Total $175,278 $205,685 Long-term debt $255,000 Owners' equity Common stock and paid-in surplus $160,000 Fixed assets Accumulated retained earnings 214,915 Net plant and equipment...
Following is a comparative balance sheet for Summer Days Corporation: Summer Days Corporation Comparative Balance Sheet...
Following is a comparative balance sheet for Summer Days Corporation: Summer Days Corporation Comparative Balance Sheet December 31, 2019 and 2018 20192018 Current assets: Cash$ 150,000$ 90,000 Short-term investments90,00080,000 Accounts receivable, net350,000220,000 Inventory400,000430,000 Prepaid expenses30,00030,000 Total current assets$1,020,000$ 850,000 Property, plant, and equipment, net750,000500,000 Other assets280,000300,000 Total assets$2,050,000$1,650,000 Current liabilities: Short-term notes payable$650,000$670,000 Accounts payable200,000225,000 Total current liabilities$850,000$895,000 Non-current debt180,000220,000 Total liabilities$1,030,000$1,115,000 Shareholders' equity: Common shares$500,000$500,000 Retained earnings410,00035,000 Total shareholders' equity$ 910,000$535,000 Total liabilities and shareholders' equity$2,140,000$1,650,000 Notes: Net sales...
Bethesda Mining Company reports the following balance sheet information for 2015 and 2016. BETHESDA MINING COMPANY...
Bethesda Mining Company reports the following balance sheet information for 2015 and 2016. BETHESDA MINING COMPANY Balance Sheets as of December 31, 2015 and 2016 2015 2016 2015 2016 Assets Liabilities and Owners’ Equity Current assets Current liabilities Cash $ 70,322 $ 88,509 Accounts payable $ 185,922 $ 193,611 Accounts receivable 66,281 86,639 Notes payable 81,020 132,588 Inventory 114,322 178,920 Total $ 266,942 $ 326,199 Total $ 250,925 $ 354,068 Long-term debt $ 229,000 $ 165,750 Owners’ equity Common stock...
Bethesda Mining Company reports the following balance sheet information for 2015 and 2016. BETHESDA MINING COMPANY...
Bethesda Mining Company reports the following balance sheet information for 2015 and 2016. BETHESDA MINING COMPANY Balance Sheets as of December 31, 2015 and 2016 2015 2016 2015 2016 Assets Liabilities and Owners’ Equity Current assets Current liabilities Cash $ 60,538 $ 76,386 Accounts payable $ 187,922 $ 195,611 Accounts receivable 64,281 84,639 Notes payable 83,020 134,588 Inventory 119,029 184,177 Total $ 270,942 $ 330,199 Total $ 243,848 $ 345,202 Long-term debt $ 233,000 $ 169,750 Owners’ equity Common stock...
please show how numbers are calculated. and all work must be done in excel CHAPTER 3:...
 please show how numbers are calculated. and all work
must be done in excel
CHAPTER 3: FINANCIAL STATEMENT ANALYSIS TOOLS NOTE: PLEASE USE WORKSHEET #3 IN THE ATTACHED EXCEL FILE TITLED "Homework for Chapter 3 Excel TO SOLVE THE FOLLOWING PROBLEM. Homework for Chapter 3: Problem in the text (Chapter 3) Sweet Dreams Corp. Balance Sheet As of Dec. 31 2017 Assets 2017 2016 Cash 431,000 339,000 Accounts Receivable 503.000 365,000 Inventories 289,000 300,000 Total Current Assets 1.223,000 7,004,000 Sweet...
please show how numbers are calculated. and all work
must be done in excel
CHAPTER 3: FINANCIAL STATEMENT ANALYSIS TOOLS NOTE: PLEASE USE WORKSHEET #3 IN THE ATTACHED EXCEL FILE TITLED "Homework for Chapter 3 Excel TO SOLVE THE FOLLOWING PROBLEM. Homework for Chapter 3: Problem in the text (Chapter 3) Sweet Dreams Corp. Balance Sheet As of Dec. 31 2017 Assets 2017 2016 Cash 431,000 339,000 Accounts Receivable 503.000 365,000 Inventories 289,000 300,000 Total Current Assets 1.223,000 7,004,000 Sweet...
 LO3 restion Fwoc Problem Solving (S Marks) Sepma Corporation Comparative Balance Sheet As at June 30, 2016 and 2037 (Millions of Dollars) Assets Cash Accounts Receivable Inventory 2017 $630 2016 $ 20 72 48 100 120 Gross fixed assets Accumulated depreciation Net fixed assets 480 160 400 160 240 320 Total assets 432 548 Uiabilities and owners 'equilty 128 Accounts payable 80 Notes payable 36- 32. Long term debt Common stock Retained earnings Total liabilities and owners 'equity 100 132...
 Just Dew It Corporation reports the following balance sheet information for 2017 and 2018 ook $ 73,750 $ 63,750 rences JUST DEW IT CORPORATION 2017 and 2018 Balance Sheets Assets Liabilities and Owners' Equity 2017 2018 2017 2018 Current assets Current liabilities $ 10,500 $10.450 Cash Accounts payable 28,250 Accounts receivable 28,600 Notes payable 50,000 49,750 $ 123,750 $ 113,500 Inventory 64,300 63,500 Total $ 103,050 $ 102,550 $ 63,600 $ 64,600 Total Long-term debt Owners' equity Common stock and...
 Calculate ratios. (10 4,5,6) AP E18-17 Rinker Corporation's comparative balance sheet is presented below. RINKER CORPORATION Balance Sheet December 31 2016 Cash Accounts receivable Inventory Land Buildings Accumulated depreciation--buildings Total Accounts payable Common shares Retained earnings Total 2017 $ 5,300 21,200 9,000 20,000 70,000 (15,000) $110,500 S 3,700 23,400 7,000 26,000 70,000 (10,000) $120,100 $ 10,370 75,000 25,130 $110,500 $ 31,100 69,000 20,000 $120,100 Rinker's 2017 income statement included net sales of $120,000, cost of goods sold of S70,000, and...
 15 and 16
PART 2 Understanding Financial Statements and Cash Flow 2016 BETHESDA MINING COMPANY Balance Sheets as of December 31, 2015 and 2016 2015 2016 2015 Assets Liabilities and Owners' Equity Current assets Cash Current liabilities $ 19,256 $ 21,946 Accounts receivable Accounts payable $171,531 46,396 54,486 Inventory Notes payable 79,218 109,626 129.253 Total $250.749 Total $175,278 $205,685 Long-term debt $255,000 Owners' equity Common stock and paid-in surplus $160,000 Fixed assets Accumulated retained earnings 214,915 Net plant and equipment...
15 and 16
PART 2 Understanding Financial Statements and Cash Flow 2016 BETHESDA MINING COMPANY Balance Sheets as of December 31, 2015 and 2016 2015 2016 2015 Assets Liabilities and Owners' Equity Current assets Cash Current liabilities $ 19,256 $ 21,946 Accounts receivable Accounts payable $171,531 46,396 54,486 Inventory Notes payable 79,218 109,626 129.253 Total $250.749 Total $175,278 $205,685 Long-term debt $255,000 Owners' equity Common stock and paid-in surplus $160,000 Fixed assets Accumulated retained earnings 214,915 Net plant and equipment...
 please show how numbers are calculated. and all work
must be done in excel
CHAPTER 3: FINANCIAL STATEMENT ANALYSIS TOOLS NOTE: PLEASE USE WORKSHEET #3 IN THE ATTACHED EXCEL FILE TITLED "Homework for Chapter 3 Excel TO SOLVE THE FOLLOWING PROBLEM. Homework for Chapter 3: Problem in the text (Chapter 3) Sweet Dreams Corp. Balance Sheet As of Dec. 31 2017 Assets 2017 2016 Cash 431,000 339,000 Accounts Receivable 503.000 365,000 Inventories 289,000 300,000 Total Current Assets 1.223,000 7,004,000 Sweet...
please show how numbers are calculated. and all work
must be done in excel
CHAPTER 3: FINANCIAL STATEMENT ANALYSIS TOOLS NOTE: PLEASE USE WORKSHEET #3 IN THE ATTACHED EXCEL FILE TITLED "Homework for Chapter 3 Excel TO SOLVE THE FOLLOWING PROBLEM. Homework for Chapter 3: Problem in the text (Chapter 3) Sweet Dreams Corp. Balance Sheet As of Dec. 31 2017 Assets 2017 2016 Cash 431,000 339,000 Accounts Receivable 503.000 365,000 Inventories 289,000 300,000 Total Current Assets 1.223,000 7,004,000 Sweet...
Most questions answered within 3 hours.
-
Where is the error in this code sequence?
String s1 = "Hello";
String s2 = "ello";...
asked 10 months ago -
Financial data for Joel de Paris, Inc., for last year
follow:
Joel de Paris, Inc.
Balance...
asked 10 months ago -
Consider this reaction:
Al2(SO4)3 (aq)+ BaCl3
(aq) Al2Cl6 (aq)- +
3BaSO4(s) . What is the...
asked 10 months ago -
Suppose that Savneet is considering increasing her
recent random sample from 20 car rentals to 40...
asked 10 months ago -
Trucks arrive at an unloading terminal at an average rate of 120
per hour.
Trucks arrive...
asked 10 months ago -
Why are methanol and ethanol completely soluble in water while
octanol is not very little soluble....
asked 10 months ago -
A facilities manager at a university reads in a research report
that the mean amount of...
asked 10 months ago -
When the CuSO4 is rehydrated by adding water to the anhydrous
compound, is this an endothermic...
asked 10 months ago -
A ray of sunlight is passing from diamond into crown glass; the
angle of incidence is...
asked 10 months ago -
A block of mass 0.249 kg is placed on top of a light, vertical
spring of...
asked 10 months ago -
how do the kidneys compensate in the presences of acidosis
a) trigger hyperventilate
b) reserve acid...
asked 10 months ago -
Question 501 pts
The rental rate of capital to the firm increases. Which of the
following...
asked 10 months ago