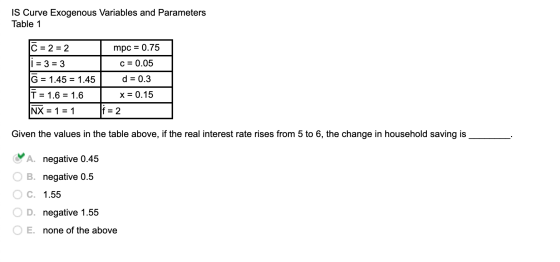
Given the values in the table above, if the real interest rate
rises from 5 to 6, the change in household saving is
________.

I don't understand what I am doing wrong here.
Homework Answers
Savings function can be derived as the income that is not spent on consumption. Below is the formula used for the calculation of savings:
When the interest rate is 5:
Calculate Y:
Calculate savings function:

When the interest rate is 6:
Calculate Y:
Calculate savings function:

The change in the household savings is:
Therefore, the correct option is (d).
Add Answer to:
Given the values in the table above, if the real interest rate
rises from 5 to...
c) How would your answer to (b) above change if consumption in Oregon were a negative...
 c) How would your answer to (b) above change if consumption in Oregon were a negative function of the interest rate. Fpr each of the four variables state: rises more, rises less, rises same, falls less, falls more, falls same, no change, or ambiguous. No computations necessary. In 2-3 sentences explain why this assumption for consumer behavior might be more realistic. This exercise is similar to exam question. Please hand it in on Oct 10, 2019. It will be counted...
Can anyone help please? Procedure B. Record the measured values in this table. Times of Fall...
 Can anyone help please?
Procedure B. Record the measured values in this table. Times of Fall (s) Av. Time (s) Height (m) t. 5 38.5430 ·ら190 , 5027 |-505 , Soyl 613 1. 3 i.2 Record heights used and squares of average times in the following table. h (m) 12 ( . 3lt1 , 2732 230 1. 3 2. s'/m Slope of graph Graphically determined value of g Percentage error in g m/s (based on comparison to standard) 1-6 Determination...
Can anyone help please?
Procedure B. Record the measured values in this table. Times of Fall (s) Av. Time (s) Height (m) t. 5 38.5430 ·ら190 , 5027 |-505 , Soyl 613 1. 3 i.2 Record heights used and squares of average times in the following table. h (m) 12 ( . 3lt1 , 2732 230 1. 3 2. s'/m Slope of graph Graphically determined value of g Percentage error in g m/s (based on comparison to standard) 1-6 Determination...
1. What is the relationship between real interest rate, nominal interest rate and inflation rate? 2....
1. What is the relationship between real interest rate, nominal interest rate and inflation rate? 2. What are the reasons for very high nominal interest rates in the 1980s? 3. Someone buys a 5 year government treasury bond at $P t a. Can the price be above face value? Why? b. Can the price be below face value? Why? c. If he/she wants to sell it after 2 years, will he/she makes a positive rate of return or negative rate...
2) When the real wage is above the level that equilibrates supply and demand: Select one: a. It creates a deadweight loss in the labor market. b. the quantity of labor demanded exceeds the quantity su...
2) When the real wage is above the level that equilibrates supply and demand: Select one: a. It creates a deadweight loss in the labor market. b. the quantity of labor demanded exceeds the quantity supplied. c. GDP definitely rises. d. Interest rate rises. 3) If Central Bank A cares only about keeping the price level stable and Central Bank B cares only about keeping output at its natural level, then in response to an exogenous increase in the price...
3. Calculating interest rates The real risk-free rate (r*) is 2.8% and is expected to remain...
 3. Calculating interest rates The real risk-free rate (r*) is 2.8% and is expected to remain constant. Inflation is expected to be 3% per year for each of the next two years and 2% thereafter. The maturity risk premium (MRP) is determined from the formula: 0.1(t - 1)%, where t is the security's maturity. The liquidity premium (LP) on all Tahoe Hydroponics's bonds is 0.55%. The following table shows the current relationship between bond ratings and default risk premiums (DRP):...
2 8 25 25 The above table has the demand and supply schedules for money. Real...
 2 8 25 25 The above table has the demand and supply schedules for money. Real GDP increase s and, as a result, the demand for money t increases by $0.2 trlion at each level of the nominal A. 10 percent B. 7 percent. OC. 2 percent. D. 5 percent. C. E, 3 percent. 6. The GDP price index in the United States in 2002 was about 85, and real GDP in 2002 was 31 2.9 trillion (2009 dollars). x...
FE x[n] -1 4. Given a causal LTI system as shown in the signal flow graph above where the coefficien t r is real: (a) Determine the system function, H (z). (5) (b) Determine a minimum multiply I/...
 FE x[n] -1 4. Given a causal LTI system as shown in the signal flow graph above where the coefficien t r is real: (a) Determine the system function, H (z). (5) (b) Determine a minimum multiply I/O difference equation. (5) (c) Is the system linear phase? Yes or No and why! (10) FE-5 5/13/2019 EENG751
FE x[n] -1 4. Given a causal LTI system as shown in the signal flow graph above where the coefficien t r is real:...
FE x[n] -1 4. Given a causal LTI system as shown in the signal flow graph above where the coefficien t r is real: (a) Determine the system function, H (z). (5) (b) Determine a minimum multiply I/O difference equation. (5) (c) Is the system linear phase? Yes or No and why! (10) FE-5 5/13/2019 EENG751
FE x[n] -1 4. Given a causal LTI system as shown in the signal flow graph above where the coefficien t r is real:...
The year-end price and dividend information on a stock is given in the following table. Year...
 The year-end price and dividend information on a stock is given in the following table. Year 1 2 3 Price 24.60 23.60 22.50 Dividend MA 0.18 0.20 Note: NA denotes not applicable. a. What is the nominal return of the stock in years 2 and 3? (Negative values should be indicated by a minus sign. Round your answers to 2 decimal places.) Nominal Return Year 2 % 3 b. What is the corresponding real return if the inflation rates for...
Based on the test set above, calculate the precision rate. Based on the test set above, calculate the recall rate. calculate the F1 measure. calculate the misclassification rate. 1-4. The table below...
 Based on the test set above, calculate the precision rate.
Based on the test set above, calculate the recall rate.
calculate the F1 measure.
calculate the misclassification rate.
1-4. The table below shows the predictions made for a categorical target feature by a model for a test dataset. ID Target Prediction ID Target Prediction ID Target Prediction 8 true 1 false false 15 false false true 2 false 9 false false 16 false false false 3 false false 10 false...
Based on the test set above, calculate the precision rate.
Based on the test set above, calculate the recall rate.
calculate the F1 measure.
calculate the misclassification rate.
1-4. The table below shows the predictions made for a categorical target feature by a model for a test dataset. ID Target Prediction ID Target Prediction ID Target Prediction 8 true 1 false false 15 false false true 2 false 9 false false 16 false false false 3 false false 10 false...
Fill in the missing values in the table above for a quarterly comparison of sectors with...
Fill in the missing values in the table above for a quarterly comparison of sectors with the S&P 500 Index. Remember when performing calculations that the numbers shown are percentage values. Record your answers as percentage values to two decimal places. Sector Portfolio Weighting (2) S&P Weighting (3) Differences in Weighting (4) Portfolio Return (5) S&P Return (6) Sector Over- or Under Performance (7) = (3) x (6) Sector Allocation Contributions Telecommunications Services 3.10% 5.90% A 2.50% 3.10% K U...
 c) How would your answer to (b) above change if consumption in Oregon were a negative function of the interest rate. Fpr each of the four variables state: rises more, rises less, rises same, falls less, falls more, falls same, no change, or ambiguous. No computations necessary. In 2-3 sentences explain why this assumption for consumer behavior might be more realistic. This exercise is similar to exam question. Please hand it in on Oct 10, 2019. It will be counted...
 Can anyone help please?
Procedure B. Record the measured values in this table. Times of Fall (s) Av. Time (s) Height (m) t. 5 38.5430 ·ら190 , 5027 |-505 , Soyl 613 1. 3 i.2 Record heights used and squares of average times in the following table. h (m) 12 ( . 3lt1 , 2732 230 1. 3 2. s'/m Slope of graph Graphically determined value of g Percentage error in g m/s (based on comparison to standard) 1-6 Determination...
Can anyone help please?
Procedure B. Record the measured values in this table. Times of Fall (s) Av. Time (s) Height (m) t. 5 38.5430 ·ら190 , 5027 |-505 , Soyl 613 1. 3 i.2 Record heights used and squares of average times in the following table. h (m) 12 ( . 3lt1 , 2732 230 1. 3 2. s'/m Slope of graph Graphically determined value of g Percentage error in g m/s (based on comparison to standard) 1-6 Determination...
 3. Calculating interest rates The real risk-free rate (r*) is 2.8% and is expected to remain constant. Inflation is expected to be 3% per year for each of the next two years and 2% thereafter. The maturity risk premium (MRP) is determined from the formula: 0.1(t - 1)%, where t is the security's maturity. The liquidity premium (LP) on all Tahoe Hydroponics's bonds is 0.55%. The following table shows the current relationship between bond ratings and default risk premiums (DRP):...
 2 8 25 25 The above table has the demand and supply schedules for money. Real GDP increase s and, as a result, the demand for money t increases by $0.2 trlion at each level of the nominal A. 10 percent B. 7 percent. OC. 2 percent. D. 5 percent. C. E, 3 percent. 6. The GDP price index in the United States in 2002 was about 85, and real GDP in 2002 was 31 2.9 trillion (2009 dollars). x...
 FE x[n] -1 4. Given a causal LTI system as shown in the signal flow graph above where the coefficien t r is real: (a) Determine the system function, H (z). (5) (b) Determine a minimum multiply I/O difference equation. (5) (c) Is the system linear phase? Yes or No and why! (10) FE-5 5/13/2019 EENG751
FE x[n] -1 4. Given a causal LTI system as shown in the signal flow graph above where the coefficien t r is real:...
FE x[n] -1 4. Given a causal LTI system as shown in the signal flow graph above where the coefficien t r is real: (a) Determine the system function, H (z). (5) (b) Determine a minimum multiply I/O difference equation. (5) (c) Is the system linear phase? Yes or No and why! (10) FE-5 5/13/2019 EENG751
FE x[n] -1 4. Given a causal LTI system as shown in the signal flow graph above where the coefficien t r is real:...
 The year-end price and dividend information on a stock is given in the following table. Year 1 2 3 Price 24.60 23.60 22.50 Dividend MA 0.18 0.20 Note: NA denotes not applicable. a. What is the nominal return of the stock in years 2 and 3? (Negative values should be indicated by a minus sign. Round your answers to 2 decimal places.) Nominal Return Year 2 % 3 b. What is the corresponding real return if the inflation rates for...
 Based on the test set above, calculate the precision rate.
Based on the test set above, calculate the recall rate.
calculate the F1 measure.
calculate the misclassification rate.
1-4. The table below shows the predictions made for a categorical target feature by a model for a test dataset. ID Target Prediction ID Target Prediction ID Target Prediction 8 true 1 false false 15 false false true 2 false 9 false false 16 false false false 3 false false 10 false...
Based on the test set above, calculate the precision rate.
Based on the test set above, calculate the recall rate.
calculate the F1 measure.
calculate the misclassification rate.
1-4. The table below shows the predictions made for a categorical target feature by a model for a test dataset. ID Target Prediction ID Target Prediction ID Target Prediction 8 true 1 false false 15 false false true 2 false 9 false false 16 false false false 3 false false 10 false...
Most questions answered within 3 hours.
-
Where is the error in this code sequence?
String s1 = "Hello";
String s2 = "ello";...
asked 10 months ago -
Financial data for Joel de Paris, Inc., for last year
follow:
Joel de Paris, Inc.
Balance...
asked 10 months ago -
Consider this reaction:
Al2(SO4)3 (aq)+ BaCl3
(aq) Al2Cl6 (aq)- +
3BaSO4(s) . What is the...
asked 10 months ago -
Suppose that Savneet is considering increasing her
recent random sample from 20 car rentals to 40...
asked 10 months ago -
Trucks arrive at an unloading terminal at an average rate of 120
per hour.
Trucks arrive...
asked 10 months ago -
Why are methanol and ethanol completely soluble in water while
octanol is not very little soluble....
asked 10 months ago -
A facilities manager at a university reads in a research report
that the mean amount of...
asked 10 months ago -
When the CuSO4 is rehydrated by adding water to the anhydrous
compound, is this an endothermic...
asked 10 months ago -
A ray of sunlight is passing from diamond into crown glass; the
angle of incidence is...
asked 10 months ago -
A block of mass 0.249 kg is placed on top of a light, vertical
spring of...
asked 10 months ago -
how do the kidneys compensate in the presences of acidosis
a) trigger hyperventilate
b) reserve acid...
asked 10 months ago -
Question 501 pts
The rental rate of capital to the firm increases. Which of the
following...
asked 10 months ago