1.This graph shows an AD/AS analysis with labels hidden If the economy starts at A and...
1.This graph shows an AD/AS analysis with labels hidden
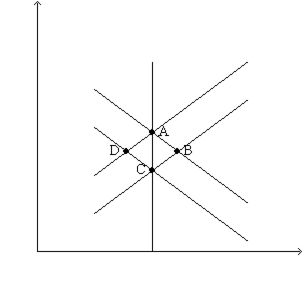
If the economy starts at A and there is a fall in aggregate demand, the economy moves
back to A in the long run.
to D in the long run.
to C in the long run.
to B in the long run.
Homework Answers
Correct option is (3).
A fall in aggregate demand will shift AD curve (the downward sloping curve) leftward, intersecting AS curve (the upward rising curve) at point D in short run, which will decrease price level and decrease real GDP in short run. In long run, lower price level lowers input costs, so firms increase output, raising aggregate supply. The AS curve shifts rightward in long run, intersecting the new AD curve at point C in long run, leading to further lower price level but restoring real GDP to original GDP level.
Add Answer to:
1.This graph shows an AD/AS analysis with labels hidden
If the economy starts at A and...
1.Which of the following is true about aggregate demand? It is the sum of the demand...
1.Which of the following is true about aggregate demand? It is the sum of the demand for all goods and services produced in an economy. It includes demand from households, firms, governments, and foreign markets. In equilibrium, it is simply real GDP. All of the above. 2.Which of the following statements is correct? Monetary policy takes a long time to be implemented. The Fed usually foresees macroeconomic problems. Monetary policy, once implemented, is immediately effective. Monetary policy decisions can be...
The graph shows the economy in long-run equilibrium Then the world economy expands and the demand...
 The graph shows the economy in long-run equilibrium Then the world economy expands and the demand for U.S.-produced goods increases Price level (GDP deflator, 2009-100) 14 Draw a curve that shows 1) the effect of increased demand for U.S.-produced goods. Label it 1 2) the effect of a rising money wage rate that returns the economy to full employment. Label it 2. Draw a point at the new long-run equilibrium 13 SAS 12 An economy is in a long-run equilibrium....
1. The diagram below shows an AD/AS model for a hypothetical economy. The economy begins in...
 1. The diagram below shows an AD/AS model for a hypothetical economy. The economy begins in long-run equilibrium at point A. Price Level - AD, -t-AD₂ 1250 700 800 900 1000 Real GDP C. Describe a plausible economic event (ie. Shock) that could have shifted the AD curve from AD1 to AD2? D. Please describe the adjustment process that would return the economy to its long-run equilibrium following the negative aggregate demand shock shown in the diagram.
The following graph shows the economy in long-run equilibrium atthe expected price level of 120...
 The following graph shows the economy in long-run equilibrium at
the expected price level of 120 and the natural level of output of
$600 billion. Suppose a sudden and severe contraction in the
housing market reduces the value of homes and causes consumers to
spend less.Shift the short-run aggregate supply (AS) curve or the aggregate
demand (AD) curve to show the short-run impact of
the housing market slump.In the short run, the decrease in consumption spending
associated with the housing...
The following graph shows the economy in long-run equilibrium at
the expected price level of 120 and the natural level of output of
$600 billion. Suppose a sudden and severe contraction in the
housing market reduces the value of homes and causes consumers to
spend less.Shift the short-run aggregate supply (AS) curve or the aggregate
demand (AD) curve to show the short-run impact of
the housing market slump.In the short run, the decrease in consumption spending
associated with the housing...
Use the graph to answer the questions below: Assume that the economy is initially at point...
 Use the graph to answer the questions below:
Assume that the economy is initially at point X. Suppose a fall
in consumer spending growth moves the economy to point Z. In
theory, the government can
(increase/decrease)?
aggregate demand by
(2%, 3%, 5%, 8%, 10%)?
to steer the economy back to the original equilibrium of point
X. Suppose the economy is at point W. In theory, the government
can
(increase/decrease)?
aggregate demand by
(2%, 3%, 5%, 8%, 10%)?
to steer the...
Use the graph to answer the questions below:
Assume that the economy is initially at point X. Suppose a fall
in consumer spending growth moves the economy to point Z. In
theory, the government can
(increase/decrease)?
aggregate demand by
(2%, 3%, 5%, 8%, 10%)?
to steer the economy back to the original equilibrium of point
X. Suppose the economy is at point W. In theory, the government
can
(increase/decrease)?
aggregate demand by
(2%, 3%, 5%, 8%, 10%)?
to steer the...
The following graph shows the economy in long-run equilibrium at the expected price level of 120 and the natural level of output of $600 billion
 The following graph shows the economy in long-run equilibrium at the expected price level of 120 and the natural level of output of $600 billion. suppose firms become pessimistic about future business conditions and cut back on investment spending. shift the short-run aggregate supply (AS) curve or the aggregate demand (AD) curve to show the short-run impact of the business pessimism.
Draw a basic aggregate demand and aggregate supply graph (with LRAS constant) that shows the economy...
Draw a basic aggregate demand and aggregate supply graph (with LRAS constant) that shows the economy in long-run equilibrium. a. Assume that there is a large increase in demand for U.S. exports. Show the resulting short-run equilibrium on your graph. In this short-run equilibrium, is the unemployment rate likely to be higher or lower than it was before the increase in exports? Briefly explain. Explain how the economy adjusts back to long-run equilibrium. When the economy has adjusted back to...
Economics chart The following graph shows the economy in long-run equilibrium at the price level of...
 Economics chart The following graph shows the economy in long-run equilibrium at the price level of 120 and potential output of $300 billion. Suppose several foreign economies experience severe recessions, causing foreign purchases of domestic goods and services to decline sharply. Shift the short-run aggregate supply (AS) curve or the aggregate demand (AD) curve to show the short-run impact of the economic turmoil abroad. Tool tip: Click and drag one or both of the curves. Curves will snap into position, so if...
Assignment Score: NaN% Resources Hint Check Answer Question 4 of 13 > The graph shows the...
 Assignment Score: NaN% Resources Hint Check Answer Question 4 of 13 > The graph shows the aggregate demand (AD) curve and the long-run aggregate supply (LRAS) curve for a hypothetical economy. Suppose that the economy experiences an increase in the human capital of workers, causing productivity to rise Show the effect of this change by shifting one of the curves in the graph. How will this change affect the price level? The price level will rise. The price level will...
8. Economic fluctuations I The following graph shows the economy in long-run equilibrium at the expected...
 8. Economic fluctuations I The following graph shows the economy in long-run equilibrium at the expected price level of 120 and the natural level of output of $300 billion. Suppose the government increases spending on building and repairing highways, bridges, and ports. Shift the short-run aggregate supply (AS) curve or the aggregate demand (AD) curve to show the short-run impact of the increase in government spending. In the short run, the increase in government spending on infrastructure causes the price level to _______...
 The graph shows the economy in long-run equilibrium Then the world economy expands and the demand for U.S.-produced goods increases Price level (GDP deflator, 2009-100) 14 Draw a curve that shows 1) the effect of increased demand for U.S.-produced goods. Label it 1 2) the effect of a rising money wage rate that returns the economy to full employment. Label it 2. Draw a point at the new long-run equilibrium 13 SAS 12 An economy is in a long-run equilibrium....
 1. The diagram below shows an AD/AS model for a hypothetical economy. The economy begins in long-run equilibrium at point A. Price Level - AD, -t-AD₂ 1250 700 800 900 1000 Real GDP C. Describe a plausible economic event (ie. Shock) that could have shifted the AD curve from AD1 to AD2? D. Please describe the adjustment process that would return the economy to its long-run equilibrium following the negative aggregate demand shock shown in the diagram.
 The following graph shows the economy in long-run equilibrium at
the expected price level of 120 and the natural level of output of
$600 billion. Suppose a sudden and severe contraction in the
housing market reduces the value of homes and causes consumers to
spend less.Shift the short-run aggregate supply (AS) curve or the aggregate
demand (AD) curve to show the short-run impact of
the housing market slump.In the short run, the decrease in consumption spending
associated with the housing...
The following graph shows the economy in long-run equilibrium at
the expected price level of 120 and the natural level of output of
$600 billion. Suppose a sudden and severe contraction in the
housing market reduces the value of homes and causes consumers to
spend less.Shift the short-run aggregate supply (AS) curve or the aggregate
demand (AD) curve to show the short-run impact of
the housing market slump.In the short run, the decrease in consumption spending
associated with the housing...
 Use the graph to answer the questions below:
Assume that the economy is initially at point X. Suppose a fall
in consumer spending growth moves the economy to point Z. In
theory, the government can
(increase/decrease)?
aggregate demand by
(2%, 3%, 5%, 8%, 10%)?
to steer the economy back to the original equilibrium of point
X. Suppose the economy is at point W. In theory, the government
can
(increase/decrease)?
aggregate demand by
(2%, 3%, 5%, 8%, 10%)?
to steer the...
Use the graph to answer the questions below:
Assume that the economy is initially at point X. Suppose a fall
in consumer spending growth moves the economy to point Z. In
theory, the government can
(increase/decrease)?
aggregate demand by
(2%, 3%, 5%, 8%, 10%)?
to steer the economy back to the original equilibrium of point
X. Suppose the economy is at point W. In theory, the government
can
(increase/decrease)?
aggregate demand by
(2%, 3%, 5%, 8%, 10%)?
to steer the...
 The following graph shows the economy in long-run equilibrium at the expected price level of 120 and the natural level of output of $600 billion. suppose firms become pessimistic about future business conditions and cut back on investment spending. shift the short-run aggregate supply (AS) curve or the aggregate demand (AD) curve to show the short-run impact of the business pessimism.
 Assignment Score: NaN% Resources Hint Check Answer Question 4 of 13 > The graph shows the aggregate demand (AD) curve and the long-run aggregate supply (LRAS) curve for a hypothetical economy. Suppose that the economy experiences an increase in the human capital of workers, causing productivity to rise Show the effect of this change by shifting one of the curves in the graph. How will this change affect the price level? The price level will rise. The price level will...
Most questions answered within 3 hours.
-
Where is the error in this code sequence?
String s1 = "Hello";
String s2 = "ello";...
asked 10 months ago -
Financial data for Joel de Paris, Inc., for last year
follow:
Joel de Paris, Inc.
Balance...
asked 10 months ago -
Consider this reaction:
Al2(SO4)3 (aq)+ BaCl3
(aq) Al2Cl6 (aq)- +
3BaSO4(s) . What is the...
asked 10 months ago -
Suppose that Savneet is considering increasing her
recent random sample from 20 car rentals to 40...
asked 10 months ago -
Trucks arrive at an unloading terminal at an average rate of 120
per hour.
Trucks arrive...
asked 10 months ago -
Why are methanol and ethanol completely soluble in water while
octanol is not very little soluble....
asked 10 months ago -
A facilities manager at a university reads in a research report
that the mean amount of...
asked 10 months ago -
When the CuSO4 is rehydrated by adding water to the anhydrous
compound, is this an endothermic...
asked 10 months ago -
A ray of sunlight is passing from diamond into crown glass; the
angle of incidence is...
asked 10 months ago -
A block of mass 0.249 kg is placed on top of a light, vertical
spring of...
asked 10 months ago -
how do the kidneys compensate in the presences of acidosis
a) trigger hyperventilate
b) reserve acid...
asked 10 months ago -
Question 501 pts
The rental rate of capital to the firm increases. Which of the
following...
asked 10 months ago