Using the formulas in Table 4.1 and Urban Outfitters’s financial statement starting on page 117, calculate the following measures of financial performance. Be sure to report items (a) through (e) in percentages (i.e., multiply your result x 100).
a. Gross profit margin
b. Operating profit margin
c. Net profit margin
d. Times-interest-earned (or coverage) ratio
e. Return on stockholders’ equity
f. Return on assets
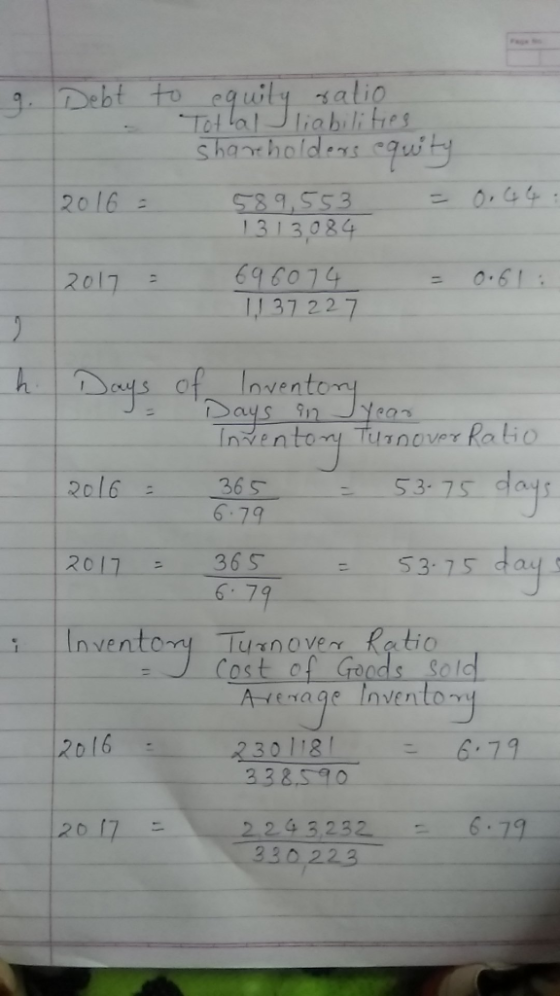
g. Debt-to-equity ratio
h. Days of inventory
i. Inventory turnover ratio
j. Average collection period
From 2016 to 2017, Urban Outfitters’s gross profit margins showed: Favorable increase or decrease, unfavorable, neither?
From 2016 to 2017, Urban Outfitters’s return on equity and return on assets showed which of the following: favorable increase or decrease, unfavorable, neither?
From 2016 to 2017, Urban Outfitters’s times-interest-earned ratio showed which of the following: favorable increase or decrease, unfavorable, neither?
From 2016 to 2017, Urban Outfitters's debt-to-equity ratio showed: favorable increase or decrease, unfavorable, neither?


Homework Answers


Add Answer to:
Using the formulas in Table 4.1 and Urban Outfitters’s financial
statement starting on page 117, calculate...
Can this question please be answered? 1) Using the formulas in Table 4.1 and Urban Outfitters’s...
 Can this question please be answered?
1) Using the formulas in Table 4.1 and Urban Outfitters’s
financial statement starting on page 117, calculate the following
measures of financial performance. Be sure to report items (a)
through (e) in percentages (i.e., multiply your result x 100).
a. Gross profit margin
b. Operating profit margin
c. Net profit margin
d. Times-interest-earned (or coverage) ratio
e. Return on stockholders’ equity
f. Return on assets
g. Debt-to-equity ratio
h. Days of inventory
i. Inventory...
Can this question please be answered?
1) Using the formulas in Table 4.1 and Urban Outfitters’s
financial statement starting on page 117, calculate the following
measures of financial performance. Be sure to report items (a)
through (e) in percentages (i.e., multiply your result x 100).
a. Gross profit margin
b. Operating profit margin
c. Net profit margin
d. Times-interest-earned (or coverage) ratio
e. Return on stockholders’ equity
f. Return on assets
g. Debt-to-equity ratio
h. Days of inventory
i. Inventory...
Using the following information: Calculate the following ratios for Urban Outfitters for both 2016 and 2017...
 Using the following information:
Calculate the following ratios for Urban Outfitters for
both 2016 and
2017 (show calculations):
a. Gross profit margin
b. Operating profit margin
c. Net profit margin
d. Times interest earned coverage
e. Return on shareholders’ equity
f. Return on assets
g. Debt-to-equity ratio
h. Days of inventory
i. Inventory turnover ratio
j. Average collection period
Consolidated Income Statements for Urban ters, Inc. 2016 2017 $3.545.794 $3,445,134 Net sales (total revenue) 2,301,181 2,243,232 Cost of sales 906,086...
Using the following information:
Calculate the following ratios for Urban Outfitters for
both 2016 and
2017 (show calculations):
a. Gross profit margin
b. Operating profit margin
c. Net profit margin
d. Times interest earned coverage
e. Return on shareholders’ equity
f. Return on assets
g. Debt-to-equity ratio
h. Days of inventory
i. Inventory turnover ratio
j. Average collection period
Consolidated Income Statements for Urban ters, Inc. 2016 2017 $3.545.794 $3,445,134 Net sales (total revenue) 2,301,181 2,243,232 Cost of sales 906,086...
SHort answer Required information Ratio Analysis: Urban Outfitters Assessing how well a company's strategy is presently...
 SHort answer
Required information Ratio Analysis: Urban Outfitters Assessing how well a company's strategy is presently working involves evaluating the strategy from both a qualitative standpoint and a quantitative standpoint. The stronger a company's current overall performance, the less likely the need for radical strategy changes. The weaker a company's performance, the more its current strategy must be questioned. Table 4.1 provides a compilation of the financial ratios most commonly used to evaluate a company's financial performance and balance sheet...
SHort answer
Required information Ratio Analysis: Urban Outfitters Assessing how well a company's strategy is presently working involves evaluating the strategy from both a qualitative standpoint and a quantitative standpoint. The stronger a company's current overall performance, the less likely the need for radical strategy changes. The weaker a company's performance, the more its current strategy must be questioned. Table 4.1 provides a compilation of the financial ratios most commonly used to evaluate a company's financial performance and balance sheet...
Ratios 2016 2015 a. Gross profit margin (%) 39.4 39.1 b. Operating profit margin (%) 5.1...
 Ratios
2016
2015
a.
Gross profit margin (%)
39.4
39.1
b.
Operating profit margin (%)
5.1
7.5
c.
Net profit margin (%)
2.4
4.0
d.
Return on shareholders' equity (%)
14.1
25.2
e.
Return on assets (%)
3.1
5.2
f.
Times interest earned coverage
3.6
5.6
g.
Long-term debt-to-equity ratio
1.5
3.8
h.
Days of inventory
126.2
121.8
i.
Inventory turnover ratio
2.9
3.0
j.
Average collection
period
7.4
7.5
1-From 2015 to 2016, Macy’s, Inc., return on equity and...
Ratios
2016
2015
a.
Gross profit margin (%)
39.4
39.1
b.
Operating profit margin (%)
5.1
7.5
c.
Net profit margin (%)
2.4
4.0
d.
Return on shareholders' equity (%)
14.1
25.2
e.
Return on assets (%)
3.1
5.2
f.
Times interest earned coverage
3.6
5.6
g.
Long-term debt-to-equity ratio
1.5
3.8
h.
Days of inventory
126.2
121.8
i.
Inventory turnover ratio
2.9
3.0
j.
Average collection
period
7.4
7.5
1-From 2015 to 2016, Macy’s, Inc., return on equity and...
Using the financial ratios provided in Table 4.1 and the financial statement infor- mation presented below...
 Using the financial ratios provided in Table 4.1 and the financial statement infor- mation presented below for Costco Wholesale Corporation, calculate the follow ing ratios for Costco for both 2013 and 2014: a. Gross profit margin b. Operating profit margin c. Net profit margin d. Times-interest-earned (or coverage) ratio e. Return on stockholders' equity 1. 1 f. Return on assets g. Debt-to-equity ratio h. Days of inventory . Inventory turnover ratio j. Average collection period Based on these ratios, did...
Directions: Ratio Calculation On each data tab, use formulas to calculate the following financial indicators for...
Directions: Ratio Calculation On each data tab, use formulas to calculate the following financial indicators for each year of data: o Current ratio o Debt/equity ratio o Free cash flow o Earnings per share o Price/earnings ratio o Return on equity o Net profit margin o Describe how and why each of the ratios has changed over the three-year period. For example, did the current ratio increase or decrease? Why? Describe how three of the ratios you calculated for your...
Note the industry average ratios below: A/R days (based on average balances) = 57 days A/P days (based on average balances) = 23 days Current ratio (based on ending balance) = 1.8x Based on Acme’s A...
 Note the industry average ratios below:
A/R days (based on average balances) = 57 days
A/P days (based on average balances) = 23 days
Current ratio (based on ending balance) = 1.8x
Based on Acme’s A/R days, A/P days and Current ratios for the
nine months ending September 30, 2017, which of the following
conclusions is most accurate? Assume 273 days in the nine months
ending September 30, 2017 and 365 days in the year.
Compared to the industry average:...
Note the industry average ratios below:
A/R days (based on average balances) = 57 days
A/P days (based on average balances) = 23 days
Current ratio (based on ending balance) = 1.8x
Based on Acme’s A/R days, A/P days and Current ratios for the
nine months ending September 30, 2017, which of the following
conclusions is most accurate? Assume 273 days in the nine months
ending September 30, 2017 and 365 days in the year.
Compared to the industry average:...
Calculate the Net Working Capital and Current Ratio for Jacobs Engineering Group for 201 JACOBS ENGINEERING...
 Calculate the Net Working Capital and Current Ratio for Jacobs Engineering Group for 201 JACOBS ENGINEERING GROUP INC. AND SUBSIDIARIES CONSOLIDATED BALANCE SHEETS (In thousands, except share information) At September 29, 2017 and September 30, 2016 ASSETS Current Assets 655,716 2,115,663 93,091 864,470 319,673 Cash and cash equivalents 774,151 S 2,102,543 119,486 996,180 349,911 Prepaid expenses and other current assets Total current assets Property, Equipment, and Improvements, net Other Noncurrent Assets Goodwill Intangibles, net Miscellaneons 3,009,826 332,920 692,022 4,034,768 3,079,628...
Calculate the following financial ratios for fiscal year 2018 only using the "Consolidated Statements of Earn"...
 Calculate the following financial ratios for fiscal year 2018
only using the "Consolidated Statements of Earn" and "Consolidated
Balance Sheets" worksheets in Starbucks 2017 and 2018 Annual
Financial Statements : Current Ratio, Cash Ratio, Inventory
Turnover, Days Sales in Inventory, Long Term Debt Ratio, Times
Interest Earned, Gross Profit Margin, Net Profit Margin, Return on
Equity, Return on Assets.
12 Months Ended Oct. 01, 2017 Sep. 30, 2018 Oct. 02, 2016 $ 22,386.8 9,034,3 6,493.3 500.3 1,011.4 1,450.7 153.5 18,643.5...
Calculate the following financial ratios for fiscal year 2018
only using the "Consolidated Statements of Earn" and "Consolidated
Balance Sheets" worksheets in Starbucks 2017 and 2018 Annual
Financial Statements : Current Ratio, Cash Ratio, Inventory
Turnover, Days Sales in Inventory, Long Term Debt Ratio, Times
Interest Earned, Gross Profit Margin, Net Profit Margin, Return on
Equity, Return on Assets.
12 Months Ended Oct. 01, 2017 Sep. 30, 2018 Oct. 02, 2016 $ 22,386.8 9,034,3 6,493.3 500.3 1,011.4 1,450.7 153.5 18,643.5...
Calculate the following financial ratios for fiscal year 2018 only using the "Consolidated Statements of Earn"...
 Calculate the following financial ratios for fiscal year 2018
only using the "Consolidated Statements of Earn" and "Consolidated
Balance Sheets" worksheets in Starbucks 2017 and 2018 Annual
Financial Statements: Current Ratio, Cash Ratio, Inventory
Turnover, Days Sales in Inventory, Long Term Debt Ratio, Times
Interest Earned, Gross Profit Margin, Net Profit Margin, Return on
Equity, Return on Assets.
12 Months Ended Oct. 01, 2017 Sep. 30, 2018 Oct. 02, 2016 $ 22,386.8 9,034,3 6,493.3 500.3 1,011.4 1,450.7 153.5 18,643.5 $...
Calculate the following financial ratios for fiscal year 2018
only using the "Consolidated Statements of Earn" and "Consolidated
Balance Sheets" worksheets in Starbucks 2017 and 2018 Annual
Financial Statements: Current Ratio, Cash Ratio, Inventory
Turnover, Days Sales in Inventory, Long Term Debt Ratio, Times
Interest Earned, Gross Profit Margin, Net Profit Margin, Return on
Equity, Return on Assets.
12 Months Ended Oct. 01, 2017 Sep. 30, 2018 Oct. 02, 2016 $ 22,386.8 9,034,3 6,493.3 500.3 1,011.4 1,450.7 153.5 18,643.5 $...
 Can this question please be answered?
1) Using the formulas in Table 4.1 and Urban Outfitters’s
financial statement starting on page 117, calculate the following
measures of financial performance. Be sure to report items (a)
through (e) in percentages (i.e., multiply your result x 100).
a. Gross profit margin
b. Operating profit margin
c. Net profit margin
d. Times-interest-earned (or coverage) ratio
e. Return on stockholders’ equity
f. Return on assets
g. Debt-to-equity ratio
h. Days of inventory
i. Inventory...
Can this question please be answered?
1) Using the formulas in Table 4.1 and Urban Outfitters’s
financial statement starting on page 117, calculate the following
measures of financial performance. Be sure to report items (a)
through (e) in percentages (i.e., multiply your result x 100).
a. Gross profit margin
b. Operating profit margin
c. Net profit margin
d. Times-interest-earned (or coverage) ratio
e. Return on stockholders’ equity
f. Return on assets
g. Debt-to-equity ratio
h. Days of inventory
i. Inventory...
 Using the following information:
Calculate the following ratios for Urban Outfitters for
both 2016 and
2017 (show calculations):
a. Gross profit margin
b. Operating profit margin
c. Net profit margin
d. Times interest earned coverage
e. Return on shareholders’ equity
f. Return on assets
g. Debt-to-equity ratio
h. Days of inventory
i. Inventory turnover ratio
j. Average collection period
Consolidated Income Statements for Urban ters, Inc. 2016 2017 $3.545.794 $3,445,134 Net sales (total revenue) 2,301,181 2,243,232 Cost of sales 906,086...
Using the following information:
Calculate the following ratios for Urban Outfitters for
both 2016 and
2017 (show calculations):
a. Gross profit margin
b. Operating profit margin
c. Net profit margin
d. Times interest earned coverage
e. Return on shareholders’ equity
f. Return on assets
g. Debt-to-equity ratio
h. Days of inventory
i. Inventory turnover ratio
j. Average collection period
Consolidated Income Statements for Urban ters, Inc. 2016 2017 $3.545.794 $3,445,134 Net sales (total revenue) 2,301,181 2,243,232 Cost of sales 906,086...
 SHort answer
Required information Ratio Analysis: Urban Outfitters Assessing how well a company's strategy is presently working involves evaluating the strategy from both a qualitative standpoint and a quantitative standpoint. The stronger a company's current overall performance, the less likely the need for radical strategy changes. The weaker a company's performance, the more its current strategy must be questioned. Table 4.1 provides a compilation of the financial ratios most commonly used to evaluate a company's financial performance and balance sheet...
SHort answer
Required information Ratio Analysis: Urban Outfitters Assessing how well a company's strategy is presently working involves evaluating the strategy from both a qualitative standpoint and a quantitative standpoint. The stronger a company's current overall performance, the less likely the need for radical strategy changes. The weaker a company's performance, the more its current strategy must be questioned. Table 4.1 provides a compilation of the financial ratios most commonly used to evaluate a company's financial performance and balance sheet...
 Ratios
2016
2015
a.
Gross profit margin (%)
39.4
39.1
b.
Operating profit margin (%)
5.1
7.5
c.
Net profit margin (%)
2.4
4.0
d.
Return on shareholders' equity (%)
14.1
25.2
e.
Return on assets (%)
3.1
5.2
f.
Times interest earned coverage
3.6
5.6
g.
Long-term debt-to-equity ratio
1.5
3.8
h.
Days of inventory
126.2
121.8
i.
Inventory turnover ratio
2.9
3.0
j.
Average collection
period
7.4
7.5
1-From 2015 to 2016, Macy’s, Inc., return on equity and...
Ratios
2016
2015
a.
Gross profit margin (%)
39.4
39.1
b.
Operating profit margin (%)
5.1
7.5
c.
Net profit margin (%)
2.4
4.0
d.
Return on shareholders' equity (%)
14.1
25.2
e.
Return on assets (%)
3.1
5.2
f.
Times interest earned coverage
3.6
5.6
g.
Long-term debt-to-equity ratio
1.5
3.8
h.
Days of inventory
126.2
121.8
i.
Inventory turnover ratio
2.9
3.0
j.
Average collection
period
7.4
7.5
1-From 2015 to 2016, Macy’s, Inc., return on equity and...
 Using the financial ratios provided in Table 4.1 and the financial statement infor- mation presented below for Costco Wholesale Corporation, calculate the follow ing ratios for Costco for both 2013 and 2014: a. Gross profit margin b. Operating profit margin c. Net profit margin d. Times-interest-earned (or coverage) ratio e. Return on stockholders' equity 1. 1 f. Return on assets g. Debt-to-equity ratio h. Days of inventory . Inventory turnover ratio j. Average collection period Based on these ratios, did...
 Note the industry average ratios below:
A/R days (based on average balances) = 57 days
A/P days (based on average balances) = 23 days
Current ratio (based on ending balance) = 1.8x
Based on Acme’s A/R days, A/P days and Current ratios for the
nine months ending September 30, 2017, which of the following
conclusions is most accurate? Assume 273 days in the nine months
ending September 30, 2017 and 365 days in the year.
Compared to the industry average:...
Note the industry average ratios below:
A/R days (based on average balances) = 57 days
A/P days (based on average balances) = 23 days
Current ratio (based on ending balance) = 1.8x
Based on Acme’s A/R days, A/P days and Current ratios for the
nine months ending September 30, 2017, which of the following
conclusions is most accurate? Assume 273 days in the nine months
ending September 30, 2017 and 365 days in the year.
Compared to the industry average:...
 Calculate the Net Working Capital and Current Ratio for Jacobs Engineering Group for 201 JACOBS ENGINEERING GROUP INC. AND SUBSIDIARIES CONSOLIDATED BALANCE SHEETS (In thousands, except share information) At September 29, 2017 and September 30, 2016 ASSETS Current Assets 655,716 2,115,663 93,091 864,470 319,673 Cash and cash equivalents 774,151 S 2,102,543 119,486 996,180 349,911 Prepaid expenses and other current assets Total current assets Property, Equipment, and Improvements, net Other Noncurrent Assets Goodwill Intangibles, net Miscellaneons 3,009,826 332,920 692,022 4,034,768 3,079,628...
 Calculate the following financial ratios for fiscal year 2018
only using the "Consolidated Statements of Earn" and "Consolidated
Balance Sheets" worksheets in Starbucks 2017 and 2018 Annual
Financial Statements : Current Ratio, Cash Ratio, Inventory
Turnover, Days Sales in Inventory, Long Term Debt Ratio, Times
Interest Earned, Gross Profit Margin, Net Profit Margin, Return on
Equity, Return on Assets.
12 Months Ended Oct. 01, 2017 Sep. 30, 2018 Oct. 02, 2016 $ 22,386.8 9,034,3 6,493.3 500.3 1,011.4 1,450.7 153.5 18,643.5...
Calculate the following financial ratios for fiscal year 2018
only using the "Consolidated Statements of Earn" and "Consolidated
Balance Sheets" worksheets in Starbucks 2017 and 2018 Annual
Financial Statements : Current Ratio, Cash Ratio, Inventory
Turnover, Days Sales in Inventory, Long Term Debt Ratio, Times
Interest Earned, Gross Profit Margin, Net Profit Margin, Return on
Equity, Return on Assets.
12 Months Ended Oct. 01, 2017 Sep. 30, 2018 Oct. 02, 2016 $ 22,386.8 9,034,3 6,493.3 500.3 1,011.4 1,450.7 153.5 18,643.5...
 Calculate the following financial ratios for fiscal year 2018
only using the "Consolidated Statements of Earn" and "Consolidated
Balance Sheets" worksheets in Starbucks 2017 and 2018 Annual
Financial Statements: Current Ratio, Cash Ratio, Inventory
Turnover, Days Sales in Inventory, Long Term Debt Ratio, Times
Interest Earned, Gross Profit Margin, Net Profit Margin, Return on
Equity, Return on Assets.
12 Months Ended Oct. 01, 2017 Sep. 30, 2018 Oct. 02, 2016 $ 22,386.8 9,034,3 6,493.3 500.3 1,011.4 1,450.7 153.5 18,643.5 $...
Calculate the following financial ratios for fiscal year 2018
only using the "Consolidated Statements of Earn" and "Consolidated
Balance Sheets" worksheets in Starbucks 2017 and 2018 Annual
Financial Statements: Current Ratio, Cash Ratio, Inventory
Turnover, Days Sales in Inventory, Long Term Debt Ratio, Times
Interest Earned, Gross Profit Margin, Net Profit Margin, Return on
Equity, Return on Assets.
12 Months Ended Oct. 01, 2017 Sep. 30, 2018 Oct. 02, 2016 $ 22,386.8 9,034,3 6,493.3 500.3 1,011.4 1,450.7 153.5 18,643.5 $...
Most questions answered within 3 hours.
-
Where is the error in this code sequence?
String s1 = "Hello";
String s2 = "ello";...
asked 10 months ago -
Financial data for Joel de Paris, Inc., for last year
follow:
Joel de Paris, Inc.
Balance...
asked 10 months ago -
Consider this reaction:
Al2(SO4)3 (aq)+ BaCl3
(aq) Al2Cl6 (aq)- +
3BaSO4(s) . What is the...
asked 10 months ago -
Suppose that Savneet is considering increasing her
recent random sample from 20 car rentals to 40...
asked 10 months ago -
Trucks arrive at an unloading terminal at an average rate of 120
per hour.
Trucks arrive...
asked 10 months ago -
Why are methanol and ethanol completely soluble in water while
octanol is not very little soluble....
asked 10 months ago -
A facilities manager at a university reads in a research report
that the mean amount of...
asked 10 months ago -
When the CuSO4 is rehydrated by adding water to the anhydrous
compound, is this an endothermic...
asked 10 months ago -
A ray of sunlight is passing from diamond into crown glass; the
angle of incidence is...
asked 10 months ago -
A block of mass 0.249 kg is placed on top of a light, vertical
spring of...
asked 10 months ago -
how do the kidneys compensate in the presences of acidosis
a) trigger hyperventilate
b) reserve acid...
asked 10 months ago -
Question 501 pts
The rental rate of capital to the firm increases. Which of the
following...
asked 10 months ago