
Homework Answers
| X | x-x¯ | (x-x¯)² | |
| 23 | 0 | 0 | |
| 14 | -9 | 81 | |
| 32 | 9 | 81 | |
| 29 | 6 | 36 | |
| 17 | -6 | 36 | |
| Total | 115 | ∑(x-x¯)²=234 | |
| Mean(x¯) | 115/5=23 |
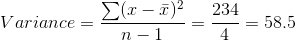
Ans: 58.5
Add Answer to:
Find the sample variance for the following data set 23 14 32 29 17 18 58.5...
14/ For the data set 8, 6, 29, 3, 9, 23, 15, 18, 5, 3, 22,...
14/ For the data set 8, 6, 29, 3, 9, 23, 15, 18, 5, 3, 22, 27, 4, 2 and 22 the midrange is A./ 16 B/ 11 C/ 15 D/ 18 15/ By the Empirical Rule, in a city of 62,000 people, the number of people below the mean by more than 1 standard deviation is: A./ 41,160 B/ 9, 920 C/ 21,080 D/ 6,200 Questions 16-18 : Use the distribution in the form of the stem-leaf plot. Stem...
Given the sample data. x: 23 17 13 32 27 (a) Find the range. (b) Verify...
 Given the sample data. x: 23 17 13 32 27 (a) Find the range. (b) Verify that Zr = 112 and Zr2 = 2,740. 2x= Zr2- (c) Use the results of part (b) and appropriate computation formulas to compute the sample variance s2 and sample standard deviation s. (Round your answers to two decimal places.) (d) Use the defining formulas to compute the sample variance s2 and sample standard deviation s. (Round your answers to two decimal places.) (e) Suppose...
Find the sample variance and the standard deviation for the following sample. Round the answers to...
 Find the sample variance and the standard deviation for the following sample. Round the answers to at least two decimal places as needed. 18 32 22 17 11 Send data to Excel The sample variance is The sample standard deviation is
For the data listed(assume sample). a.) Find the following: Mean Mode Median Midrange Range Quartiles Variance...
For the data listed(assume sample). a.) Find the following: Mean Mode Median Midrange Range Quartiles Variance Standard Deviation BoxPlot b.) Create a frequency distribution When creating classes use the formula from the Notes on how classes to create. 17 23 14 16 12 26 20 22 14 15 22 18 18 21 21 19 15 21 18 17 15 25 14 30 16 10 20 12 16 17.44 16 14 15 20 20 16 17 16 15 15 19 48...
Find the sample variance and the standard deviation for the following sample. Round the answers to at least two deci...
 Find the sample variance and the standard deviation for the following sample. Round the answers to at least two decimal places as needed. 18 32 22 17 11 Send data to Excel The sample variance is The sample standard deviation is
Male: 7, 10, 14, 18, 22,24, 28, 29, 34, 42 Female: 15, 18, 23, 32, 36,...
Male: 7, 10, 14, 18, 22,24, 28, 29, 34, 42 Female: 15, 18, 23, 32, 36, 39, 41, 46, 53, 61 Use z-scores to determine which data point would be more extreme relative to their gender: a male who spends 18 minutes or a female who spends 18 minutes each morning on grooming and hygiene.
A sample set is as the following with a missing value x. It is known that-18...
 A sample set is as the following with a missing value x. It is known that-18 x1 101212 12 141414 1414 16 16 18 1820 2020 22 3035 What is the missing data value of the data set? What is the median? What is the variance? 9.What is the variance, if this is a population? 10. Does it skew? (Right, Left, or Not) A population is listed as the followin 10 15 11. 12. 13. 14. 15. 16. Find μ...
Consider a sample with data values of 27, 24, 23, 19, 32, 36, 29, and 24....
 Consider a sample with data values of 27, 24, 23, 19, 32, 36,
29, and 24. Compute the 20th, 25th, 65th, and 75th
percentiles
eBook Consider a sample with data values of 27, 24, 23, 19, 32, 36, 29, and 24. Compute the 20th, 25th, 65th, and 75th percentiles (to 1 decimal, if decimals are necessary). 20th percentile 25th percentile 65th percentile 75th percentile
Consider a sample with data values of 27, 24, 23, 19, 32, 36,
29, and 24. Compute the 20th, 25th, 65th, and 75th
percentiles
eBook Consider a sample with data values of 27, 24, 23, 19, 32, 36, 29, and 24. Compute the 20th, 25th, 65th, and 75th percentiles (to 1 decimal, if decimals are necessary). 20th percentile 25th percentile 65th percentile 75th percentile
For the follwoing date find: 30 20 35 17 50 54 64 29 34 23 20...
For the follwoing date find: 30 20 35 17 50 54 64 29 34 23 20 20 21 50 26 26 20 48 20 30 23 29 17 17 20 18 23 36 20 20 1. The Mean= 2. The Median= 3. The Mode= 4. The Range = 5. The Standard Deviation is = 6. The Variance is= 7. Q1Q1 = 8. Q3Q3 = 9. IQR= 10. Upper Fence= 11. Lower Fence is = 12.If you graphed the data above,...
Represent sample 20, 13, 19, 18, 20, 15, 14, 21, 16, 23 by some histogram. Find...
Represent sample 20, 13, 19, 18, 20, 15, 14, 21, 16, 23 by some histogram. Find sample mean and sample variance.
 Given the sample data. x: 23 17 13 32 27 (a) Find the range. (b) Verify that Zr = 112 and Zr2 = 2,740. 2x= Zr2- (c) Use the results of part (b) and appropriate computation formulas to compute the sample variance s2 and sample standard deviation s. (Round your answers to two decimal places.) (d) Use the defining formulas to compute the sample variance s2 and sample standard deviation s. (Round your answers to two decimal places.) (e) Suppose...
 Find the sample variance and the standard deviation for the following sample. Round the answers to at least two decimal places as needed. 18 32 22 17 11 Send data to Excel The sample variance is The sample standard deviation is
 Find the sample variance and the standard deviation for the following sample. Round the answers to at least two decimal places as needed. 18 32 22 17 11 Send data to Excel The sample variance is The sample standard deviation is
 A sample set is as the following with a missing value x. It is known that-18 x1 101212 12 141414 1414 16 16 18 1820 2020 22 3035 What is the missing data value of the data set? What is the median? What is the variance? 9.What is the variance, if this is a population? 10. Does it skew? (Right, Left, or Not) A population is listed as the followin 10 15 11. 12. 13. 14. 15. 16. Find μ...
 Consider a sample with data values of 27, 24, 23, 19, 32, 36,
29, and 24. Compute the 20th, 25th, 65th, and 75th
percentiles
eBook Consider a sample with data values of 27, 24, 23, 19, 32, 36, 29, and 24. Compute the 20th, 25th, 65th, and 75th percentiles (to 1 decimal, if decimals are necessary). 20th percentile 25th percentile 65th percentile 75th percentile
Consider a sample with data values of 27, 24, 23, 19, 32, 36,
29, and 24. Compute the 20th, 25th, 65th, and 75th
percentiles
eBook Consider a sample with data values of 27, 24, 23, 19, 32, 36, 29, and 24. Compute the 20th, 25th, 65th, and 75th percentiles (to 1 decimal, if decimals are necessary). 20th percentile 25th percentile 65th percentile 75th percentile
Most questions answered within 3 hours.
-
Where is the error in this code sequence?
String s1 = "Hello";
String s2 = "ello";...
asked 10 months ago -
Financial data for Joel de Paris, Inc., for last year
follow:
Joel de Paris, Inc.
Balance...
asked 10 months ago -
Consider this reaction:
Al2(SO4)3 (aq)+ BaCl3
(aq) Al2Cl6 (aq)- +
3BaSO4(s) . What is the...
asked 10 months ago -
Suppose that Savneet is considering increasing her
recent random sample from 20 car rentals to 40...
asked 10 months ago -
Trucks arrive at an unloading terminal at an average rate of 120
per hour.
Trucks arrive...
asked 10 months ago -
Why are methanol and ethanol completely soluble in water while
octanol is not very little soluble....
asked 10 months ago -
A facilities manager at a university reads in a research report
that the mean amount of...
asked 10 months ago -
When the CuSO4 is rehydrated by adding water to the anhydrous
compound, is this an endothermic...
asked 10 months ago -
A ray of sunlight is passing from diamond into crown glass; the
angle of incidence is...
asked 10 months ago -
A block of mass 0.249 kg is placed on top of a light, vertical
spring of...
asked 10 months ago -
how do the kidneys compensate in the presences of acidosis
a) trigger hyperventilate
b) reserve acid...
asked 10 months ago -
Question 501 pts
The rental rate of capital to the firm increases. Which of the
following...
asked 10 months ago