Given the following scores: 62,64,65,68,70,72,72,75,75,75,76,78,81,83, 83,84,85,87,88,92,95 a. What is the mode? b. Construct a histogram c....
Given the following scores: 62,64,65,68,70,72,72,75,75,75,76,78,81,83, 83,84,85,87,88,92,95 a. What is the mode? b. Construct a histogram c. Construct a stem plot identifying outliers d. Would you describe the scores as more skewed or symmetric
Homework Answers
a)

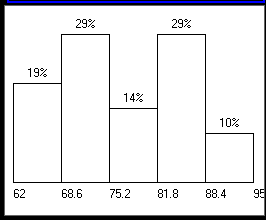
b)
Step 1: Deciding the number of categories:
# of classes = root(n), where n is the number of entries;
= root(21) = 5
Step2: Determining the indivisuals per classes:
Class Interval Freq. %
-----------------------------------------------------
1
[62, 68.6) 4 19.048%
2
[68.6, 75.2) 6 28.571%
3
[75.2, 81.8) 3 14.286%
4
[81.8, 88.4) 6 28.571%
5
[88.4, 95) 2 9.524%
Step3: Find the density for each class:
Class
Base
(%) Height(density)
---------------------------------------------------------
1
6.6 19.048% 2.886
2
6.6 28.571% 4.329
3
6.6 14.286% 2.165
4
6.6 28.571% 4.329
5
6.6 9.524% 1.443
Step4: Plot the Histogram.
c)

d)
median is less than mean Hence the scores are skewed to left.
Add Answer to:
Given the following scores:
62,64,65,68,70,72,72,75,75,75,76,78,81,83, 83,84,85,87,88,92,95 a.
What is the mode? b. Construct a histogram c....
Construct a stem-and-leaf plot of the test scores 67, 73, 85, 75, 89, 89, 87, 90, 98, 100
 Construct a stem-and-leaf plot of the test scores 67, 73, 85, 75, 89, 89, 87, 90, 98, 100. How does the stem-and-leaf plot show the distribution of these data? Construct the stem-and-leaf plot. Choose the correct answer below. How does the stem-and-leaf plot show the distribution of these data? A. The lengths of the rows are similar to the heights of bars in a histogram: longer rows of data correspond to smaller frequencies B. The lengths of the rows are similar to the widths...
The letters A, B, and C are marked on the histogram. Describe the shape of the...
The letters A, B, and C are marked on the histogram. Describe the shape of the data. Then determine which is the mean, which is the median, and which is the mode. Justify your answers. Sick Days Used by Employees 13579111315024681012141618Number of DaysFrequency Upper AA Upper BB Upper CC A histogram titled Vacation Days Used by Employees has a horizontal axis labeled Number of Days from 1 to 15 in increments of 2 and a vertical axis labeled Frequency from...
The boxplot of the exam scores for the students in an introductory statistics course is given...
 The boxplot of the exam scores for the students in an introductory statistics course is given below. The distribution of the scores is 30 40 50 60 70 Score 80 90 100 Symmetric and bell-shaped Positively skewed O negatively skewed Symmetric but not bell-shaped A Ph.D. graduate has applied for a job with two universities: A and B. The graduate feels that she has a 60% chance of receiving an offer from university A and a 50% chance of receiving...
EIN3235 Name: Question No. (a) (b) (c) (d PID: o OO o O Oo o o...
 EIN3235 Name: Question No. (a) (b) (c) (d PID: o OO o O Oo o o O 12 13 o O O 15 16 O ooO 18 Use the following data to answer questions 1-s 36, 25, 24, 13, 12, 24, 35, 48, 24 1. What is the mean? a. 28.65 b. 26.78 2. What is the median? c 27.82 d. 25.78 c 25 d. 26 3 What is the first quartile of the data? 18.5 d. 145 4. What...
We were unable to transcribe this imageHere again is the histogram showing the distribution of times,...
 We were unable to transcribe this imageHere again is the histogram showing the distribution of times, in minutes, required for 25 rats in an animal behavior experiment to navigate a maze successfully Time for a Group of Rates to Navigate a Maze Time in Minutes Which of the following best describes the shape of the histogram? Symmetric Fught-skewed with no outliers Left-skewed with no outliers Right-skewed with a possible outlier Left-skewed with a possible outier Here again is the histogram...
2. (1.18) The following scores represent the final examination grades for an elementary statistics course: 33...
 2. (1.18) The following scores represent the final examination grades for an elementary statistics course: 33 60 79 32 57 74 52 70 82 36 80 77 81 95 41 65 92 85 55 76 52 30 64 75 78 35 80 98 81 67 a) Construct a Stem-and-Leaf Plot for the examination grades. b) Construct a Relative Frequency Histogram with 6 Class Intervals (that is: 6 rectangles) c) Compute the Sample Median Median. ) What is the Sample Mode?
Scores on an accounting exam ranged from 41 to 95, with quartiles Q1 = 50.25, Q2...
 Scores on an accounting exam ranged from 41 to 95, with
quartiles Q1 = 50.25, Q2 = 58.5, Q3 = 81.50. (a) Select the correct
box plot for the given data.
(a) Select the correct box plot for the given
data.
BoxPlot A
BoxPlot B
BoxPlot C
A B C
(b) Describe its shape (skewed left, symmetric,
skewed right).
The distribution is symmetric.
The distribution is skewed left.
The distribution is skewed right.
- BoxPlot BoxPlot 40 50...
Scores on an accounting exam ranged from 41 to 95, with
quartiles Q1 = 50.25, Q2 = 58.5, Q3 = 81.50. (a) Select the correct
box plot for the given data.
(a) Select the correct box plot for the given
data.
BoxPlot A
BoxPlot B
BoxPlot C
A B C
(b) Describe its shape (skewed left, symmetric,
skewed right).
The distribution is symmetric.
The distribution is skewed left.
The distribution is skewed right.
- BoxPlot BoxPlot 40 50...
Graphing Given a histogram with a line for a normal curve superimposed on it, interpretation of...
Graphing Given a histogram with a line for a normal curve superimposed on it, interpretation of the distribution of scores may be ambiguous. If the bars on the histogram are above the line for the normal distribution superimposed on the histogram, then the variable distribution is leptokurtic ("peaked"). If they are below the line, then it is platykurtic ("flat"). However, if the bars cross the line on only one side, then it is skewed. If they cross more on the...
10. The following data represent the scores of students on a particular exam. 3 4 31...
 10. The following data represent the scores of students on a particular exam. 3 4 31 4 03 48 51 0122 5 789 6 444 67789 7 123 7 556 678 89 800112334 8 55 66 777 8 9 900012 344 91 55 Key: 64 means 64% on the e a) (1 point) This data is...(Circle One) Skewed Right Skewed Left Symmetric b) Compute the following measures for this data set. (3 points) Median: 78.5 - 79113 - 11. (7...
1. The following data are the distances between a sample of 20 retail stores and a...
1. The following data are the distances between a sample of 20 retail stores and a large distribution center. The distances are in miles.It is only necessary to show work for problem 1e calculations.Round all answers to two decimal places. 29, 37, 38, 40, 58, 67, 68, 69, 76, 86, 87, 95, 96, 96, 99, 106, 112, 127, 145, 150 a.Mean: _____________________Median: ____________________Mode: _____________________Range: _____________________Interquartile Range: __________ b. List the 5-number summary. c. Variance: ____________________Standard Deviation: ____________ d. Calculate the...
 The boxplot of the exam scores for the students in an introductory statistics course is given below. The distribution of the scores is 30 40 50 60 70 Score 80 90 100 Symmetric and bell-shaped Positively skewed O negatively skewed Symmetric but not bell-shaped A Ph.D. graduate has applied for a job with two universities: A and B. The graduate feels that she has a 60% chance of receiving an offer from university A and a 50% chance of receiving...
 EIN3235 Name: Question No. (a) (b) (c) (d PID: o OO o O Oo o o O 12 13 o O O 15 16 O ooO 18 Use the following data to answer questions 1-s 36, 25, 24, 13, 12, 24, 35, 48, 24 1. What is the mean? a. 28.65 b. 26.78 2. What is the median? c 27.82 d. 25.78 c 25 d. 26 3 What is the first quartile of the data? 18.5 d. 145 4. What...
 We were unable to transcribe this imageHere again is the histogram showing the distribution of times, in minutes, required for 25 rats in an animal behavior experiment to navigate a maze successfully Time for a Group of Rates to Navigate a Maze Time in Minutes Which of the following best describes the shape of the histogram? Symmetric Fught-skewed with no outliers Left-skewed with no outliers Right-skewed with a possible outlier Left-skewed with a possible outier Here again is the histogram...
 2. (1.18) The following scores represent the final examination grades for an elementary statistics course: 33 60 79 32 57 74 52 70 82 36 80 77 81 95 41 65 92 85 55 76 52 30 64 75 78 35 80 98 81 67 a) Construct a Stem-and-Leaf Plot for the examination grades. b) Construct a Relative Frequency Histogram with 6 Class Intervals (that is: 6 rectangles) c) Compute the Sample Median Median. ) What is the Sample Mode?
 Scores on an accounting exam ranged from 41 to 95, with
quartiles Q1 = 50.25, Q2 = 58.5, Q3 = 81.50. (a) Select the correct
box plot for the given data.
(a) Select the correct box plot for the given
data.
BoxPlot A
BoxPlot B
BoxPlot C
A B C
(b) Describe its shape (skewed left, symmetric,
skewed right).
The distribution is symmetric.
The distribution is skewed left.
The distribution is skewed right.
- BoxPlot BoxPlot 40 50...
Scores on an accounting exam ranged from 41 to 95, with
quartiles Q1 = 50.25, Q2 = 58.5, Q3 = 81.50. (a) Select the correct
box plot for the given data.
(a) Select the correct box plot for the given
data.
BoxPlot A
BoxPlot B
BoxPlot C
A B C
(b) Describe its shape (skewed left, symmetric,
skewed right).
The distribution is symmetric.
The distribution is skewed left.
The distribution is skewed right.
- BoxPlot BoxPlot 40 50...
 10. The following data represent the scores of students on a particular exam. 3 4 31 4 03 48 51 0122 5 789 6 444 67789 7 123 7 556 678 89 800112334 8 55 66 777 8 9 900012 344 91 55 Key: 64 means 64% on the e a) (1 point) This data is...(Circle One) Skewed Right Skewed Left Symmetric b) Compute the following measures for this data set. (3 points) Median: 78.5 - 79113 - 11. (7...
Most questions answered within 3 hours.
-
Where is the error in this code sequence?
String s1 = "Hello";
String s2 = "ello";...
asked 10 months ago -
Financial data for Joel de Paris, Inc., for last year
follow:
Joel de Paris, Inc.
Balance...
asked 10 months ago -
Consider this reaction:
Al2(SO4)3 (aq)+ BaCl3
(aq) Al2Cl6 (aq)- +
3BaSO4(s) . What is the...
asked 10 months ago -
Suppose that Savneet is considering increasing her
recent random sample from 20 car rentals to 40...
asked 10 months ago -
Trucks arrive at an unloading terminal at an average rate of 120
per hour.
Trucks arrive...
asked 10 months ago -
Why are methanol and ethanol completely soluble in water while
octanol is not very little soluble....
asked 10 months ago -
A facilities manager at a university reads in a research report
that the mean amount of...
asked 10 months ago -
When the CuSO4 is rehydrated by adding water to the anhydrous
compound, is this an endothermic...
asked 10 months ago -
A ray of sunlight is passing from diamond into crown glass; the
angle of incidence is...
asked 10 months ago -
A block of mass 0.249 kg is placed on top of a light, vertical
spring of...
asked 10 months ago -
how do the kidneys compensate in the presences of acidosis
a) trigger hyperventilate
b) reserve acid...
asked 10 months ago -
Question 501 pts
The rental rate of capital to the firm increases. Which of the
following...
asked 10 months ago