I am stuck . Please help me with the solution


Homework Answers
Add Answer to:
I am stuck . Please help me with the solution
Rainbow Company's income statement and comparative...
Preparing a Statement of Cash Flows (Direct Method) Rainbow Company's income statement and comparative balance sheets...
 Preparing a Statement of Cash Flows (Direct Method) Rainbow Company's income statement and comparative balance sheets follow. RAINBOW COMPANY Income Statement For Year Ended December 31, 2016 Sales $6,750,000 Dividend Income 135,000 Total Revenue 6,885,000 Cost of Goods Sold $3,960,000 Wages and Other Operating Expenses 1,170,000 Depreciation Expense 351,000 Patent Amortization Expense 63,000 Interest Expense 117,000 Income Tax Expense 396,000 Loss on Sale of Equipment 45,000 Gain on Sale of Investments (27,000) 6,075,000 Net Income $810,000 RAINBOW COMPANY Balance Sheets...
m Preparing a Statement of Cash Flows (Direct Method) Rainbow Company's income statement and comparative balance...
 m
Preparing a Statement of Cash Flows (Direct Method) Rainbow Company's income statement and comparative balance sheets follow. RAINBOW COMPANY Income Statement For Year Ended December 31, 2016 Sales $2,250,000 Dividend Income 45,000 2,295,000 $1,320,000 390,000 117,000 21,000 Total Revenue Cost of Goods Sold Wages and Other Operating Expenses Depreciation Expense Patent Amortization Expense Interest Expense Income Tax Expense Loss on Sale of Equipment Gain on Sale of Investments Net Income 39,000 132,000 15,000 (9,000) 2,025,000 $270,000 RAINBOW COMPANY Balance...
m
Preparing a Statement of Cash Flows (Direct Method) Rainbow Company's income statement and comparative balance sheets follow. RAINBOW COMPANY Income Statement For Year Ended December 31, 2016 Sales $2,250,000 Dividend Income 45,000 2,295,000 $1,320,000 390,000 117,000 21,000 Total Revenue Cost of Goods Sold Wages and Other Operating Expenses Depreciation Expense Patent Amortization Expense Interest Expense Income Tax Expense Loss on Sale of Equipment Gain on Sale of Investments Net Income 39,000 132,000 15,000 (9,000) 2,025,000 $270,000 RAINBOW COMPANY Balance...
Preparing a Statement of Cash Flows (Direct Method) Rainbow Company's income statement and comparative balance sheets...
 Preparing a Statement of Cash Flows (Direct Method) Rainbow Company's income statement and comparative balance sheets follow. RAINBOW COMPANY Income Statement For Year Ended December 31, 2018 Sales $750,000 Dividend Income 15,000 Total Revenue 765,000 Cost of Goods Sold $440,000 Wages and Other Operating Expenses 130,000 Depreciation Expense 39,000 Patent Amortization Expense 7,000 Interest Expense 13,000 Income Tax Expense 44,000 Loss on Sale of Equipment 5,000 Gain on Sale of Investments (3,000) 675,000 Net Income $90,000 RAINBOW COMPANY Balance Sheets...
Statement of Cash Flows (Indirect Method) The Rainbow Company's income statement and comparative balance sheets as...
 Statement of Cash Flows (Indirect Method) The Rainbow Company's income statement and comparative balance sheets as of December 31 1 of 2013 and 2012 follow: RAINBOW COMPANY Income Statement For the Year Ended December 31, 2013 Sales Revenue $825,000 Dividend Income 16,500 841,500 Cost of Goods Sold $484,000 Wages and Other Operating Expenses 143,000 Depreciation Expense 42,900 Patent Amortization Expense 7,700 Interest Expense 14,300 Income Tax Expense 48,400 Loss on Sale of Equipment 5,500 Gain on Sale of Investments (11,000)...
Statement of Cash Flows (Indirect Method) The Rainbow Company's income statement and comparative balance sheets as...
 Statement of Cash Flows (Indirect Method) The Rainbow Company's income statement and comparative balance sheets as of December 31 of 2013 and 2012 follow: RAINBOW COMPANY Income Statement For the Year Ended December 31, 2013 Sales Revenue $975,000 Dividend Income 19,500 994,500 Cost of Goods Sold $572,000 Wages and Other Operating Expenses 169,000 Depreciation Expense 50,700 Patent Amortization Expense 9,100 Interest Expense 16,900 Income Tax Expense 57,200 Loss on Sale of Equipment 6,500 Gain on Sale of Investments (13,000) 868,400...
Statement of Cash Flows The following is a list of the items to be included in the preparation of Warrick Company’s 2016 statement of cash flows: Net income, $41,600 Payment for purchase of building,...
Statement of Cash Flows The following is a list of the items to be included in the preparation of Warrick Company’s 2016 statement of cash flows: Net income, $41,600 Payment for purchase of building, $90,000 Increase in accounts receivable, $7,200 Proceeds from issuance of common stock, $37,000 Increase in accounts payable, $5,000 Proceeds from sale of land, $8,400 Depreciation expense, $20,000 Payment of dividends, $38,000 Gain on sale of land, $3,000 Decrease in inventory, $3,300 Payment for purchase of long-term...
Comparative balance sheets for 2018 and 2017 and a statement of income for 2018 are given...
 Comparative balance sheets for 2018 and 2017 and a statement of
income for 2018 are given below for Metagrobolize Industries.
Additional information from the accounting records of Metagrobolize
also is provided.
METAGROBOLIZE INDUSTRIES
Comparative Balance Sheets
December 31, 2018 and 2017
($ in 000s)
2018
2017
Assets
Cash
$
560
$
370
Accounts receivable
710
370
Inventory
860
440
Land
700
670
Building
900
900
Less: Accumulated depreciation
(200
)
(160
)
Equipment
3,400
3,230
Less: Accumulated depreciation
(343
)...
Comparative balance sheets for 2018 and 2017 and a statement of
income for 2018 are given below for Metagrobolize Industries.
Additional information from the accounting records of Metagrobolize
also is provided.
METAGROBOLIZE INDUSTRIES
Comparative Balance Sheets
December 31, 2018 and 2017
($ in 000s)
2018
2017
Assets
Cash
$
560
$
370
Accounts receivable
710
370
Inventory
860
440
Land
700
670
Building
900
900
Less: Accumulated depreciation
(200
)
(160
)
Equipment
3,400
3,230
Less: Accumulated depreciation
(343
)...
Statement of Cash Flows (Direct Method) Dair Company's income statement and comparative balance sheets follow. $...
 Statement of Cash Flows (Direct Method) Dair Company's income statement and comparative balance sheets follow. $ 700,000 DAIR COMPANY Income Statement For Year Ended December 31,2017 Sales Cost of goods sold $ 440,000 Wages and other operating expenses 95,000 Depreciation expense 22,000 Amortization expense 7,000 Interest expense 10,000 Income tax expense 36,000 Loss on bond retirement 5,000 Net income 615,000 85.000 DAIR COMPANY Balance Sheets Dec. 31, 2017 Dec. 31, 2016 Assets Cash $ 27,000 $ 18,000 Accounts receivable 53,000...
Statement of Cash Flows (Indirect Method) Dair Company's income statement and comparative balance sheets follow. DAIR...
 Statement of Cash Flows (Indirect Method) Dair Company's income statement and comparative balance sheets follow. DAIR COMPANY Income Statement For Year Ended December 31,2011 Sales $ 700,000 Cost of goods sold $ 440,000 Wages and other operating expenses 95,000 Depreciation expense 21,000 Amortization expense 6,000 Interest expense 10,000 Income tax expense 36,000 Loss on bond retirement 5,000 613,000 Net income $87,000 DAIR COMPANY Balance Sheets Dec. 31, 2011 Dec. 31, 2010 Assets Cash $ 22,000 $ 18,000 Accounts receivable 54,000...
Here are comparative balance sheets for Velo Company. Velo Company Comparative Balance Sheets December 31 Assets...
 Here are comparative balance sheets for Velo Company.
Velo Company
Comparative Balance Sheets
December 31
Assets
2020
2019
Cash
$72,800
$33,200
Accounts receivable
86,500
70,700
Inventory
170,200
187,000
Land
72,700
100,700
Equipment
260,700
200,600
Accumulated depreciation—equipment
(65,700
)
(33,500
)
Total
$597,200
$558,700
Liabilities and Stockholders’ Equity
Accounts payable
$35,400
$46,500
Bonds payable
149,800
203,300
Common stock ($1 par)
218,000
173,000
Retained earnings
194,000
135,900
Total
$597,200
$558,700
Additional information:
1.
Net income for 2020 was $103,600.
2.
Cash dividends...
Here are comparative balance sheets for Velo Company.
Velo Company
Comparative Balance Sheets
December 31
Assets
2020
2019
Cash
$72,800
$33,200
Accounts receivable
86,500
70,700
Inventory
170,200
187,000
Land
72,700
100,700
Equipment
260,700
200,600
Accumulated depreciation—equipment
(65,700
)
(33,500
)
Total
$597,200
$558,700
Liabilities and Stockholders’ Equity
Accounts payable
$35,400
$46,500
Bonds payable
149,800
203,300
Common stock ($1 par)
218,000
173,000
Retained earnings
194,000
135,900
Total
$597,200
$558,700
Additional information:
1.
Net income for 2020 was $103,600.
2.
Cash dividends...
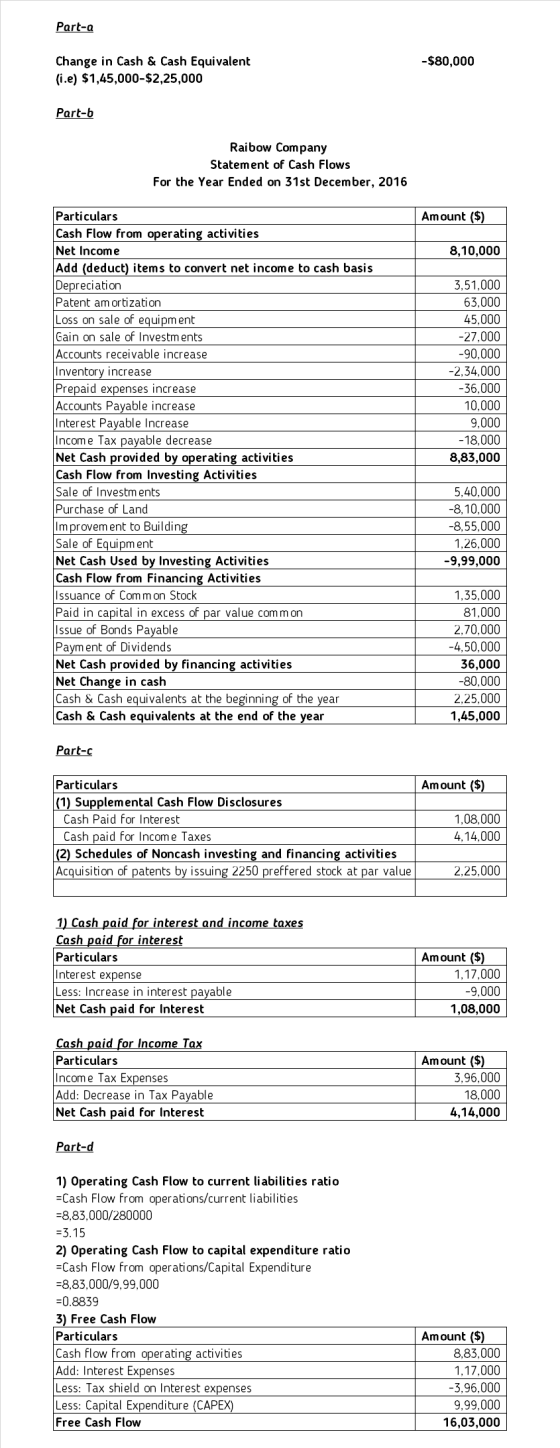
 Preparing a Statement of Cash Flows (Direct Method) Rainbow Company's income statement and comparative balance sheets follow. RAINBOW COMPANY Income Statement For Year Ended December 31, 2016 Sales $6,750,000 Dividend Income 135,000 Total Revenue 6,885,000 Cost of Goods Sold $3,960,000 Wages and Other Operating Expenses 1,170,000 Depreciation Expense 351,000 Patent Amortization Expense 63,000 Interest Expense 117,000 Income Tax Expense 396,000 Loss on Sale of Equipment 45,000 Gain on Sale of Investments (27,000) 6,075,000 Net Income $810,000 RAINBOW COMPANY Balance Sheets...
 m
Preparing a Statement of Cash Flows (Direct Method) Rainbow Company's income statement and comparative balance sheets follow. RAINBOW COMPANY Income Statement For Year Ended December 31, 2016 Sales $2,250,000 Dividend Income 45,000 2,295,000 $1,320,000 390,000 117,000 21,000 Total Revenue Cost of Goods Sold Wages and Other Operating Expenses Depreciation Expense Patent Amortization Expense Interest Expense Income Tax Expense Loss on Sale of Equipment Gain on Sale of Investments Net Income 39,000 132,000 15,000 (9,000) 2,025,000 $270,000 RAINBOW COMPANY Balance...
m
Preparing a Statement of Cash Flows (Direct Method) Rainbow Company's income statement and comparative balance sheets follow. RAINBOW COMPANY Income Statement For Year Ended December 31, 2016 Sales $2,250,000 Dividend Income 45,000 2,295,000 $1,320,000 390,000 117,000 21,000 Total Revenue Cost of Goods Sold Wages and Other Operating Expenses Depreciation Expense Patent Amortization Expense Interest Expense Income Tax Expense Loss on Sale of Equipment Gain on Sale of Investments Net Income 39,000 132,000 15,000 (9,000) 2,025,000 $270,000 RAINBOW COMPANY Balance...
 Preparing a Statement of Cash Flows (Direct Method) Rainbow Company's income statement and comparative balance sheets follow. RAINBOW COMPANY Income Statement For Year Ended December 31, 2018 Sales $750,000 Dividend Income 15,000 Total Revenue 765,000 Cost of Goods Sold $440,000 Wages and Other Operating Expenses 130,000 Depreciation Expense 39,000 Patent Amortization Expense 7,000 Interest Expense 13,000 Income Tax Expense 44,000 Loss on Sale of Equipment 5,000 Gain on Sale of Investments (3,000) 675,000 Net Income $90,000 RAINBOW COMPANY Balance Sheets...
 Statement of Cash Flows (Indirect Method) The Rainbow Company's income statement and comparative balance sheets as of December 31 1 of 2013 and 2012 follow: RAINBOW COMPANY Income Statement For the Year Ended December 31, 2013 Sales Revenue $825,000 Dividend Income 16,500 841,500 Cost of Goods Sold $484,000 Wages and Other Operating Expenses 143,000 Depreciation Expense 42,900 Patent Amortization Expense 7,700 Interest Expense 14,300 Income Tax Expense 48,400 Loss on Sale of Equipment 5,500 Gain on Sale of Investments (11,000)...
 Statement of Cash Flows (Indirect Method) The Rainbow Company's income statement and comparative balance sheets as of December 31 of 2013 and 2012 follow: RAINBOW COMPANY Income Statement For the Year Ended December 31, 2013 Sales Revenue $975,000 Dividend Income 19,500 994,500 Cost of Goods Sold $572,000 Wages and Other Operating Expenses 169,000 Depreciation Expense 50,700 Patent Amortization Expense 9,100 Interest Expense 16,900 Income Tax Expense 57,200 Loss on Sale of Equipment 6,500 Gain on Sale of Investments (13,000) 868,400...
 Comparative balance sheets for 2018 and 2017 and a statement of
income for 2018 are given below for Metagrobolize Industries.
Additional information from the accounting records of Metagrobolize
also is provided.
METAGROBOLIZE INDUSTRIES
Comparative Balance Sheets
December 31, 2018 and 2017
($ in 000s)
2018
2017
Assets
Cash
$
560
$
370
Accounts receivable
710
370
Inventory
860
440
Land
700
670
Building
900
900
Less: Accumulated depreciation
(200
)
(160
)
Equipment
3,400
3,230
Less: Accumulated depreciation
(343
)...
Comparative balance sheets for 2018 and 2017 and a statement of
income for 2018 are given below for Metagrobolize Industries.
Additional information from the accounting records of Metagrobolize
also is provided.
METAGROBOLIZE INDUSTRIES
Comparative Balance Sheets
December 31, 2018 and 2017
($ in 000s)
2018
2017
Assets
Cash
$
560
$
370
Accounts receivable
710
370
Inventory
860
440
Land
700
670
Building
900
900
Less: Accumulated depreciation
(200
)
(160
)
Equipment
3,400
3,230
Less: Accumulated depreciation
(343
)...
 Statement of Cash Flows (Direct Method) Dair Company's income statement and comparative balance sheets follow. $ 700,000 DAIR COMPANY Income Statement For Year Ended December 31,2017 Sales Cost of goods sold $ 440,000 Wages and other operating expenses 95,000 Depreciation expense 22,000 Amortization expense 7,000 Interest expense 10,000 Income tax expense 36,000 Loss on bond retirement 5,000 Net income 615,000 85.000 DAIR COMPANY Balance Sheets Dec. 31, 2017 Dec. 31, 2016 Assets Cash $ 27,000 $ 18,000 Accounts receivable 53,000...
 Statement of Cash Flows (Indirect Method) Dair Company's income statement and comparative balance sheets follow. DAIR COMPANY Income Statement For Year Ended December 31,2011 Sales $ 700,000 Cost of goods sold $ 440,000 Wages and other operating expenses 95,000 Depreciation expense 21,000 Amortization expense 6,000 Interest expense 10,000 Income tax expense 36,000 Loss on bond retirement 5,000 613,000 Net income $87,000 DAIR COMPANY Balance Sheets Dec. 31, 2011 Dec. 31, 2010 Assets Cash $ 22,000 $ 18,000 Accounts receivable 54,000...
 Here are comparative balance sheets for Velo Company.
Velo Company
Comparative Balance Sheets
December 31
Assets
2020
2019
Cash
$72,800
$33,200
Accounts receivable
86,500
70,700
Inventory
170,200
187,000
Land
72,700
100,700
Equipment
260,700
200,600
Accumulated depreciation—equipment
(65,700
)
(33,500
)
Total
$597,200
$558,700
Liabilities and Stockholders’ Equity
Accounts payable
$35,400
$46,500
Bonds payable
149,800
203,300
Common stock ($1 par)
218,000
173,000
Retained earnings
194,000
135,900
Total
$597,200
$558,700
Additional information:
1.
Net income for 2020 was $103,600.
2.
Cash dividends...
Here are comparative balance sheets for Velo Company.
Velo Company
Comparative Balance Sheets
December 31
Assets
2020
2019
Cash
$72,800
$33,200
Accounts receivable
86,500
70,700
Inventory
170,200
187,000
Land
72,700
100,700
Equipment
260,700
200,600
Accumulated depreciation—equipment
(65,700
)
(33,500
)
Total
$597,200
$558,700
Liabilities and Stockholders’ Equity
Accounts payable
$35,400
$46,500
Bonds payable
149,800
203,300
Common stock ($1 par)
218,000
173,000
Retained earnings
194,000
135,900
Total
$597,200
$558,700
Additional information:
1.
Net income for 2020 was $103,600.
2.
Cash dividends...
Most questions answered within 3 hours.
-
Where is the error in this code sequence?
String s1 = "Hello";
String s2 = "ello";...
asked 10 months ago -
Financial data for Joel de Paris, Inc., for last year
follow:
Joel de Paris, Inc.
Balance...
asked 10 months ago -
Consider this reaction:
Al2(SO4)3 (aq)+ BaCl3
(aq) Al2Cl6 (aq)- +
3BaSO4(s) . What is the...
asked 10 months ago -
Suppose that Savneet is considering increasing her
recent random sample from 20 car rentals to 40...
asked 10 months ago -
Trucks arrive at an unloading terminal at an average rate of 120
per hour.
Trucks arrive...
asked 10 months ago -
Why are methanol and ethanol completely soluble in water while
octanol is not very little soluble....
asked 10 months ago -
A facilities manager at a university reads in a research report
that the mean amount of...
asked 10 months ago -
When the CuSO4 is rehydrated by adding water to the anhydrous
compound, is this an endothermic...
asked 10 months ago -
A ray of sunlight is passing from diamond into crown glass; the
angle of incidence is...
asked 10 months ago -
A block of mass 0.249 kg is placed on top of a light, vertical
spring of...
asked 10 months ago -
how do the kidneys compensate in the presences of acidosis
a) trigger hyperventilate
b) reserve acid...
asked 10 months ago -
Question 501 pts
The rental rate of capital to the firm increases. Which of the
following...
asked 10 months ago