
Homework Answers


Add Answer to:
Table on the right shows the per capita consumption of ice cream and eggs for selected...
Table on the right shows the per capita consumption of ice cream and eggs for selected...
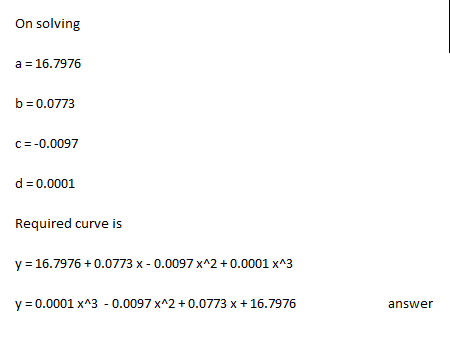
 Table on the right shows the per capita consumption of ice cream and eggs for selected years since 1980. Complete parts (A) Per Capita Consumption and (B) of Ice Cream and Eggs Ice Eggs Year cream (number) (pounds) 1980 17.3 266 1985 17.4 251 1990 15.4 231 1995 15.5 229 2000 16.9 247 2005 15.1 252 20101 14.2 242 (A) Let x represent the number of years since 1980 and find a cubic regression polynomial for the per capita consumption...
He The annual per capita consumption of ice cream (in pounds) in the United States can...
 He The annual per capita consumption of ice cream (in pounds) in the United States can be approximated by the normal distribution, as shown in the figure to the night. (a) What is the largest annual per capita consumption of ice cream that can be in the bottom 20% of consumption (b) Belwoon what two values does the middle 80% of the consumptions lie? Qu
The annual per capita consumption of ice cream in pounds) in the United States can be...
 The annual per capita consumption of ice cream in pounds) in the United States can be approximated by the normal distribution, as shown in the figure to the right (a) What is the largest annual per capita consumption of ice cream that can be in the bottom 9% of consumptions? (b) Between what two values does the middle 80% of the consumptions lie? 4-185 Con Click to view page 1 of the Standard NormalTable Click to view page 2 of...
Question 14 2 pts Ice Cream The annual per capita consumption of ice cream (in pounds)...
 Question 14 2 pts Ice Cream The annual per capita consumption of ice cream (in pounds) in the United States can be approximated by a normal distribution with mean 17.9 lb and standard deviation 4.4 lb. The middle 70% lies between Ib and ur answers to one decimal place.
The following table shows data on average per capita wine consumption and heart disease rate in...
The following table shows data on average per capita wine consumption and heart disease rate in a random sample of 10 countries. The x-value represents the yearly wine consumption (in Liters). The y-value represents the number of deaths from heart diseases. Country Wine Consumption Number of Deaths 1 1.4 201 2 4.6 199 3 4.1 194 4 0.7 220 5 0.3 291 6 5 169 7 3.3 121 8 1 292 9 1.8 261 10 4.1 133 For computation purposes,...
 Table on the right shows the per capita consumption of ice cream and eggs for selected years since 1980. Complete parts (A) Per Capita Consumption and (B) of Ice Cream and Eggs Ice Eggs Year cream (number) (pounds) 1980 17.3 266 1985 17.4 251 1990 15.4 231 1995 15.5 229 2000 16.9 247 2005 15.1 252 20101 14.2 242 (A) Let x represent the number of years since 1980 and find a cubic regression polynomial for the per capita consumption...
 He The annual per capita consumption of ice cream (in pounds) in the United States can be approximated by the normal distribution, as shown in the figure to the night. (a) What is the largest annual per capita consumption of ice cream that can be in the bottom 20% of consumption (b) Belwoon what two values does the middle 80% of the consumptions lie? Qu
 The annual per capita consumption of ice cream in pounds) in the United States can be approximated by the normal distribution, as shown in the figure to the right (a) What is the largest annual per capita consumption of ice cream that can be in the bottom 9% of consumptions? (b) Between what two values does the middle 80% of the consumptions lie? 4-185 Con Click to view page 1 of the Standard NormalTable Click to view page 2 of...
 Question 14 2 pts Ice Cream The annual per capita consumption of ice cream (in pounds) in the United States can be approximated by a normal distribution with mean 17.9 lb and standard deviation 4.4 lb. The middle 70% lies between Ib and ur answers to one decimal place.
Most questions answered within 3 hours.
-
Where is the error in this code sequence?
String s1 = "Hello";
String s2 = "ello";...
asked 10 months ago -
Financial data for Joel de Paris, Inc., for last year
follow:
Joel de Paris, Inc.
Balance...
asked 10 months ago -
Consider this reaction:
Al2(SO4)3 (aq)+ BaCl3
(aq) Al2Cl6 (aq)- +
3BaSO4(s) . What is the...
asked 10 months ago -
Suppose that Savneet is considering increasing her
recent random sample from 20 car rentals to 40...
asked 10 months ago -
Trucks arrive at an unloading terminal at an average rate of 120
per hour.
Trucks arrive...
asked 10 months ago -
Why are methanol and ethanol completely soluble in water while
octanol is not very little soluble....
asked 10 months ago -
A facilities manager at a university reads in a research report
that the mean amount of...
asked 10 months ago -
When the CuSO4 is rehydrated by adding water to the anhydrous
compound, is this an endothermic...
asked 10 months ago -
A ray of sunlight is passing from diamond into crown glass; the
angle of incidence is...
asked 10 months ago -
A block of mass 0.249 kg is placed on top of a light, vertical
spring of...
asked 10 months ago -
how do the kidneys compensate in the presences of acidosis
a) trigger hyperventilate
b) reserve acid...
asked 10 months ago -
Question 501 pts
The rental rate of capital to the firm increases. Which of the
following...
asked 10 months ago