The table below shows the maximum amount of civilian goods that an economy can produce for...
The table below shows the maximum amount of civilian goods that an economy can produce for each level of military goods produced.
|
Point |
Military Goods |
Civilian |
|
A |
0 |
60 |
|
B |
2 |
55 |
|
C |
4 |
48 |
|
D |
8 |
39 |
|
E |
10 |
28 |
|
F |
12 |
15 |
|
G |
14 |
0 |
- Graph the PPC for this economy.
- If the economy is producing at point D, what is the opportunity cost of producing an additional 2 thousand tonnes of military goods?
- If the economy is producing at point E, what is the opportunity cost of producing an additional 2 thousand tonnes of military goods?
- Does the PPC satisfy the principle of increasing opportunity cost?
Question 2
Adam is in the middle of building a new concert venue in LA. The land and the initial construction materials have already been purchased and the framing has already been completed at a cost of $2 million. It will cost another $4 million to complete the project. Unfortunately, a new study suggests that demand for concert tickets is down and that competition from the Capitol Centre is expected to increase. Adam argues that he’s already spent $2 million and might as well complete the project. Is Adam mistaken? If so, how would you categorize any fault in his thinking?
Homework Answers
PLEASE NOTE THAT I HAVE SOLVED FIRST 4 SUB PARTS OF THE FIRST QUESTION
(a)

(b) Consider that the economy is producing at D. To produce 2 thousands tonnes of military goods (i.e., to move to point E) , it has to give up 11 (i.e., 39-28) thousand tonnes of civilian goods. Hence, the opportunity cost of producing 1 thousand tonnes of military goods = 11/2 = 5.5 million tonnes of civilian goods.
(c) Now consider that the economy is producing at E. To produce 2 thousands tonnes of military goods (i.e., to move to point F) , it has to give up 13 (i.e., 28-15) thousand tonnes of civilian goods. Hence, the opportunity cost of producing 1 thousand tonnes of military goods = 13/2 = 6.5 million tonnes of civilian goods.
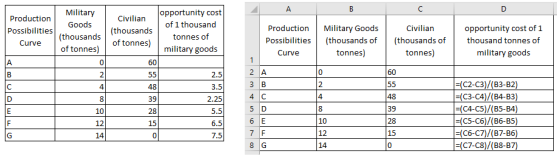
(c) The PPC does not satisfy the principle of increasing opportunity cost across all points. For example, if the economy is at B and it wants to move to point C, the opportunity cost of producing 1 thousand tonnes of military goods = (55-48)/(4-2) = 3.5. Further, when it wants to move from point C to D, the opportunity cost of producing 1 thousand tonnes of military goods = (48-39)/(8-4) = 2.5. Hence, from moving from C to D, opportunity cost declines. The tables below shows the opportunity cost of producing 1 thousand tonnes of military goods at all points. Except for the case of moving from C to D, the opportunity cost is increasing. The left side table shows the values of opportunity cost where as the right side table shows the formula view of the calculation of opportunity cost.
To satisfy the principle of increasing opportunity cost, the PPC has to be concave throughout. As can be seen from the diagram above (a), the concavity breaks in the region C to D.
Add Answer to:
The table below shows the maximum amount of civilian goods that
an economy can produce for...
5. Suppose an economy can produce two goods, A and B. It is now operating at...
 5. Suppose an economy can produce two goods, A and B. It is now operating at point E on production possibilities curve RT. An improvement in the technology available to produce good A shifts the curve to ST, and the economy selects point E'. How does this change affect the opportunity cost of producing an additional unit of good B?
Understanding Production Possibilities Using the following table for a hypothetical economy plot your data on a...
 Understanding Production Possibilities Using the following table for a hypothetical economy plot your data on a graph. Military 110 5 10s o 95 15 80 Consumer 0 60 40 35 50 10 20 60 Suppose the Economy is operating at point B. What is the opportunity cost of 10 additional units of consumer goods? Between which points is the opportunity cost of b producing consumer goods at maximum? A combination of 70 units of military goods and 45 units of...
The following graph shows the production possibilities frontier (PPF) of an economy that produces drinking water...
 The following graph shows the production possibilities frontier (PPF) of an economy that produces drinking water and oil. Points A, B, and C (X symbols) represent three possible output levels in a given month. You can place your mouse over the points to see their exact coordinates. DRINKING WATER Millions of gallons per month 800 0 10 20 30 40 50 60 70 80 OIL (Thousands of barrels per month! Help Clear All Suppose the economy initially produces 540 million...
Part 1 Below is a production possibilities table for consumer goods (butter) and capital goods (guns)....
Part 1 Below is a production possibilities table for consumer goods (butter) and capital goods (guns). Production Possibilities Type of Production Production Alternative A Production Alternative B Production Alternative C Production Alternative D Production Alternative E Production Alternative F Production Alternative G Butter 0 1 2 3 4 5 6 Guns 14 13 11 9 7 4 0 Graph the data provided in the table using Excel. (Hints: Type your data into an Excel spreadsheet. With your mouse, highlight the...
How can we assess whether a project is a success or a failure? This case presents...
 How can we assess whether a project is a success or a
failure?
This case presents two phases of a large business transformation project involving the implementation of an ERP system with the aim of creating an integrated company. The case illustrates some of the challenges associated with integration. It also presents the obstacles facing companies that undertake projects involving large information technology projects. Bombardier and Its Environment Joseph-Armand Bombardier was 15 years old when he built his first snowmobile...
How can we assess whether a project is a success or a
failure?
This case presents two phases of a large business transformation project involving the implementation of an ERP system with the aim of creating an integrated company. The case illustrates some of the challenges associated with integration. It also presents the obstacles facing companies that undertake projects involving large information technology projects. Bombardier and Its Environment Joseph-Armand Bombardier was 15 years old when he built his first snowmobile...
First, read the article on "The Delphi Method for Graduate Research." ------ Article is posted below...
First, read the article on "The Delphi Method for Graduate Research." ------ Article is posted below Include each of the following in your answer (if applicable – explain in a paragraph) Research problem: what do you want to solve using Delphi? Sample: who will participate and why? (answer in 5 -10 sentences) Round one questionnaire: include 5 hypothetical questions you would like to ask Discuss: what are possible outcomes of the findings from your study? Hint: this is the conclusion....
 5. Suppose an economy can produce two goods, A and B. It is now operating at point E on production possibilities curve RT. An improvement in the technology available to produce good A shifts the curve to ST, and the economy selects point E'. How does this change affect the opportunity cost of producing an additional unit of good B?
 Understanding Production Possibilities Using the following table for a hypothetical economy plot your data on a graph. Military 110 5 10s o 95 15 80 Consumer 0 60 40 35 50 10 20 60 Suppose the Economy is operating at point B. What is the opportunity cost of 10 additional units of consumer goods? Between which points is the opportunity cost of b producing consumer goods at maximum? A combination of 70 units of military goods and 45 units of...
 The following graph shows the production possibilities frontier (PPF) of an economy that produces drinking water and oil. Points A, B, and C (X symbols) represent three possible output levels in a given month. You can place your mouse over the points to see their exact coordinates. DRINKING WATER Millions of gallons per month 800 0 10 20 30 40 50 60 70 80 OIL (Thousands of barrels per month! Help Clear All Suppose the economy initially produces 540 million...
 How can we assess whether a project is a success or a
failure?
This case presents two phases of a large business transformation project involving the implementation of an ERP system with the aim of creating an integrated company. The case illustrates some of the challenges associated with integration. It also presents the obstacles facing companies that undertake projects involving large information technology projects. Bombardier and Its Environment Joseph-Armand Bombardier was 15 years old when he built his first snowmobile...
How can we assess whether a project is a success or a
failure?
This case presents two phases of a large business transformation project involving the implementation of an ERP system with the aim of creating an integrated company. The case illustrates some of the challenges associated with integration. It also presents the obstacles facing companies that undertake projects involving large information technology projects. Bombardier and Its Environment Joseph-Armand Bombardier was 15 years old when he built his first snowmobile...
Most questions answered within 3 hours.
-
Where is the error in this code sequence?
String s1 = "Hello";
String s2 = "ello";...
asked 10 months ago -
Financial data for Joel de Paris, Inc., for last year
follow:
Joel de Paris, Inc.
Balance...
asked 10 months ago -
Consider this reaction:
Al2(SO4)3 (aq)+ BaCl3
(aq) Al2Cl6 (aq)- +
3BaSO4(s) . What is the...
asked 10 months ago -
Suppose that Savneet is considering increasing her
recent random sample from 20 car rentals to 40...
asked 10 months ago -
Trucks arrive at an unloading terminal at an average rate of 120
per hour.
Trucks arrive...
asked 10 months ago -
Why are methanol and ethanol completely soluble in water while
octanol is not very little soluble....
asked 10 months ago -
A facilities manager at a university reads in a research report
that the mean amount of...
asked 10 months ago -
When the CuSO4 is rehydrated by adding water to the anhydrous
compound, is this an endothermic...
asked 10 months ago -
A ray of sunlight is passing from diamond into crown glass; the
angle of incidence is...
asked 10 months ago -
A block of mass 0.249 kg is placed on top of a light, vertical
spring of...
asked 10 months ago -
how do the kidneys compensate in the presences of acidosis
a) trigger hyperventilate
b) reserve acid...
asked 10 months ago -
Question 501 pts
The rental rate of capital to the firm increases. Which of the
following...
asked 10 months ago