For the following data (a) display the data in a scatter plot, (b) calculate the sample...
For the following data (a) display the data in a scatter plot, (b) calculate the sample correlation coefficient r, and (c) make a conclusion about the type of correlation. Use technology.
The earnings per share (in dollars) and the dividends per share (in dollars) for 66 medical supplies companies in a recent year are shown in the data set below.
|
Earnings per share, x |
2.74 |
5.02 |
4.57 |
3.05 |
3.77 |
2.17 |
|
|||||||||||||||
|---|---|---|---|---|---|---|---|---|---|---|---|---|---|---|---|---|---|---|---|---|---|---|
|
Dividends per share, y |
0.54 |
2.37 |
1.44 |
0.82 |
1.05 |
0.260 |
||||||||||||||||
(a) Create a scatter plot that best represents the data below. Use technology.
(c) Which of the following best describes the type of correlation that exists between earnings per share and dividends per share?
A. No linear correlation
B. Strong negative linear correlation
C. Strong positive linear correlation
D. Weak negative linear correlation
E. Weak positive linear correlation
Homework Answers
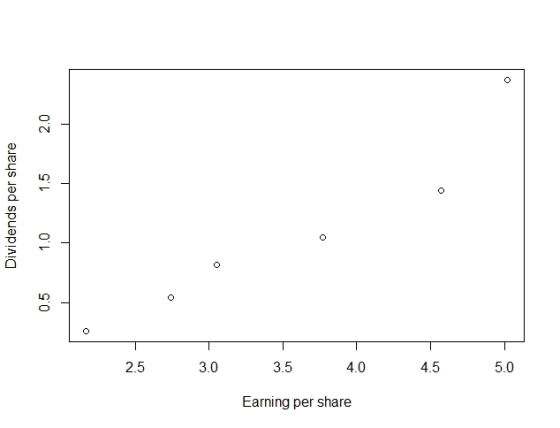
b)Sample correlation is 0.9558787.
c) There is a strong positive linear correlation as correlation is very close to 1 and also have positive sign.
Add Answer to:
For the following data (a) display the data in a scatter plot,
(b) calculate the sample...
For the following data (a) display the data in a scatter plot, (b) calculate the sample...
For the following data (a) display the data in a scatter plot, (b) calculate the sample correlation coefficient r, and (c) make a conclusion about the type of correlation. Use technology. The earnings per share (in dollars) and the dividends per share (in dollars) for six medical supplies companies in a recent year are shown in the data set below. a) choose the correct scatter plot. Use technology. (b) The correlation coefficient r is _____ (Round to three decimal places...
For the following data (a) display the data in a scatter plot, (b) calculate the sample correla...
For the following data (a) display the data in a scatter plot, (b) calculate the sample correlation coefficient r, and (c) make a conclusion about the type of correlation. Use technology. The earnings per share (in dollars) and the dividends per share (in dollars) for six medical supplies companies in a recent year are shown in the data set below. a) choose the correct scatter plot. Use technology. (b) The correlation coefficient r is _____ (Round to three decimal places...
For the following data (a) display the data in a scatter plot, (b) calculate the sample...
 For the following data (a) display the data in a scatter plot, (b) calculate the sample correlation coefficient r, and (c) make a conclusion about the type of correlation. Use technology. The eamings per share (in dollars) and the dividends per share (in dollars) for 6 medical supplies companies in a recent year are shown in the data set below. Earnings per share, x 2.74 5.05 Dividends per share,0.56 2.39 4.53 3.02 3.73 2.25 1.46 0.89 1.06 0.27 v (a)...
For the following data (a) display the data in a scatter plot, (b) calculate the correlation...
 For the following data (a) display the data in a scatter plot, (b) calculate the correlation coefficient r, and (c) make a conclusion about the type of correlation. The ages (in years) of 6 children and the number of words in their vocabulary Age, x 1. 2 3 4 5 6 Vocabulary size, y 500 450 1350 1750 2300 2300 (a) Choose the correct scatter plot below. A. B. c. D. 2350+.. 7 2350- 2350- Vocabulary Age Vocabulary Vocabulary ....
For the following data (a) display the data in a scatter plot, (b) calculate the correlation...
 For the following data (a) display the data in a scatter plot, (b) calculate the correlation coefficient r, and (c) make a conclusion about the type of correlation. The ages (in years) of 6 children and the number of words in their vocabulary Age, x 1 2 3 4 5 6 Vocabulary size, y 300 450 1500 1500 2300 2400 a Ag Vocab Vocab Vocabi . 2450 Vocabulary Age Age Age (b) The correlation coefficient r is (Round to three...
3. A sample of seven households was obtained, and information on their income and food expenditures for the past month was collected. The data (in hundreds of dollars) are: ) Put the points into...
 3. A sample of seven households was obtained, and information on their income and food expenditures for the past month was collected. The data (in hundreds of dollars) are: ) Put the points into your calculator list. Use your calculator to perform linear regression. What is the correlation? Is it positive, negative, or neither? Is it strong or weak? Find the equation of the line of best fit. (c) Write a sentence that interprets the estimated slope. (d) Use your...
The scatter plot shows the sizes and annual rents of some office spaces in the downtown...
 The scatter plot shows the sizes and annual rents of some office
spaces in the downtown area of a city.
What would the line of best fit reveal about these data?
There is a strong negative relationship between the cost of
rent and the size of the office space.
There is a strong positive relationship between the cost of
rent and the size of the office space.
There is a weak negative relationship between the cost of rent
and the...
The scatter plot shows the sizes and annual rents of some office
spaces in the downtown area of a city.
What would the line of best fit reveal about these data?
There is a strong negative relationship between the cost of
rent and the size of the office space.
There is a strong positive relationship between the cost of
rent and the size of the office space.
There is a weak negative relationship between the cost of rent
and the...
1. construct a scatter plot for the variables 2. compute the value of the correlation coefficient...
1. construct a scatter plot for the variables 2. compute the value of the correlation coefficient 3. give an explanation of the type nof relationship that exists between the two variables. The explanation should be a short paragraph. In this paragraph inclue the following: *say whether the is a strong positiv elinear correlation, weak positive linear correlation, strong ngative linear correlation, weak negative correlation, or no linear correlation between the two variables. *explain how you can see this from the...
Construct a scatter plot for the given data. Determine whether there is positive, negative, or no...
 Construct a scatter plot for the given data. Determine whether there is positive, negative, or no linear correlation. 5342 0213 1166344
4. The following table presents data on x- the number of oil changes per year and y the cost of repairs for a sample of 10 cars from a given region: Number of oil changes per year (x ost of Repai...
 4. The following table presents data on x- the number of oil changes per year and y the cost of repairs for a sample of 10 cars from a given region: Number of oil changes per year (x ost of Repairs S( e) Put the points into your calculator list. (d) Use your calculator to perform linear regression. a. What is the correlation? Is it positive, negative, or neither? Is it strong or weak? b. Find the equation of the...
 For the following data (a) display the data in a scatter plot, (b) calculate the sample correlation coefficient r, and (c) make a conclusion about the type of correlation. Use technology. The eamings per share (in dollars) and the dividends per share (in dollars) for 6 medical supplies companies in a recent year are shown in the data set below. Earnings per share, x 2.74 5.05 Dividends per share,0.56 2.39 4.53 3.02 3.73 2.25 1.46 0.89 1.06 0.27 v (a)...
 For the following data (a) display the data in a scatter plot, (b) calculate the correlation coefficient r, and (c) make a conclusion about the type of correlation. The ages (in years) of 6 children and the number of words in their vocabulary Age, x 1. 2 3 4 5 6 Vocabulary size, y 500 450 1350 1750 2300 2300 (a) Choose the correct scatter plot below. A. B. c. D. 2350+.. 7 2350- 2350- Vocabulary Age Vocabulary Vocabulary ....
 For the following data (a) display the data in a scatter plot, (b) calculate the correlation coefficient r, and (c) make a conclusion about the type of correlation. The ages (in years) of 6 children and the number of words in their vocabulary Age, x 1 2 3 4 5 6 Vocabulary size, y 300 450 1500 1500 2300 2400 a Ag Vocab Vocab Vocabi . 2450 Vocabulary Age Age Age (b) The correlation coefficient r is (Round to three...
 3. A sample of seven households was obtained, and information on their income and food expenditures for the past month was collected. The data (in hundreds of dollars) are: ) Put the points into your calculator list. Use your calculator to perform linear regression. What is the correlation? Is it positive, negative, or neither? Is it strong or weak? Find the equation of the line of best fit. (c) Write a sentence that interprets the estimated slope. (d) Use your...
 The scatter plot shows the sizes and annual rents of some office
spaces in the downtown area of a city.
What would the line of best fit reveal about these data?
There is a strong negative relationship between the cost of
rent and the size of the office space.
There is a strong positive relationship between the cost of
rent and the size of the office space.
There is a weak negative relationship between the cost of rent
and the...
The scatter plot shows the sizes and annual rents of some office
spaces in the downtown area of a city.
What would the line of best fit reveal about these data?
There is a strong negative relationship between the cost of
rent and the size of the office space.
There is a strong positive relationship between the cost of
rent and the size of the office space.
There is a weak negative relationship between the cost of rent
and the...
 Construct a scatter plot for the given data. Determine whether there is positive, negative, or no linear correlation. 5342 0213 1166344
 4. The following table presents data on x- the number of oil changes per year and y the cost of repairs for a sample of 10 cars from a given region: Number of oil changes per year (x ost of Repairs S( e) Put the points into your calculator list. (d) Use your calculator to perform linear regression. a. What is the correlation? Is it positive, negative, or neither? Is it strong or weak? b. Find the equation of the...
Most questions answered within 3 hours.
-
Where is the error in this code sequence?
String s1 = "Hello";
String s2 = "ello";...
asked 10 months ago -
Financial data for Joel de Paris, Inc., for last year
follow:
Joel de Paris, Inc.
Balance...
asked 10 months ago -
Consider this reaction:
Al2(SO4)3 (aq)+ BaCl3
(aq) Al2Cl6 (aq)- +
3BaSO4(s) . What is the...
asked 10 months ago -
Suppose that Savneet is considering increasing her
recent random sample from 20 car rentals to 40...
asked 10 months ago -
Trucks arrive at an unloading terminal at an average rate of 120
per hour.
Trucks arrive...
asked 10 months ago -
Why are methanol and ethanol completely soluble in water while
octanol is not very little soluble....
asked 10 months ago -
A facilities manager at a university reads in a research report
that the mean amount of...
asked 10 months ago -
When the CuSO4 is rehydrated by adding water to the anhydrous
compound, is this an endothermic...
asked 10 months ago -
A ray of sunlight is passing from diamond into crown glass; the
angle of incidence is...
asked 10 months ago -
A block of mass 0.249 kg is placed on top of a light, vertical
spring of...
asked 10 months ago -
how do the kidneys compensate in the presences of acidosis
a) trigger hyperventilate
b) reserve acid...
asked 10 months ago -
Question 501 pts
The rental rate of capital to the firm increases. Which of the
following...
asked 10 months ago