1. Create A scatter Diagram for these two data sets, and find the correlation. How often...
1. Create A scatter Diagram for these two data sets, and find the correlation.
|
How often do you see ads on your social media after you have typed it into another web source such as (Google, Internet explorer)1.always2.usually3.sometimes4 rarely5.never |
When you're on social networking websites how much of your time do you spend looking at what other people have posted? 1.all 2. most3.half4.some5.none |
|
| 1 | 1 | |
| 1 | 2 | |
| 1 | 2 | |
| 1 | 2 | |
| 1 | 2 | |
| 1 | 2 | |
| 1 | 2 | |
| 1 | 2 | |
| 1 | 2 | |
| 1 | 2 | |
| 1 | 2 | |
| 1 | 2 | |
| 1 | 2 | |
| 1 | 2 | |
| 1 | 2 | |
| 1 | 2 | |
| 2 | 2 | |
| 2 | 2 | |
| 2 | 2 | |
| 2 | 2 | |
| 2 | 3 | |
| 2 | 3 | |
| 2 | 3 | |
| 2 | 3 | |
| 2 | 3 | |
| 2 | 3 | |
| 2 | 4 | |
| 2 | 4 | |
| 2 | 4 | |
Homework Answers
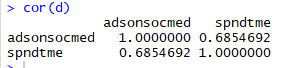
Here I attach the R code used:
d=read.csv("C:\\Users\\PC-10\\Desktop\\d.csv")
d
cor(d)
plot(d$spndtme,d$adsonsocmed,col="red")
The correlation matrix is:
The scatter plot is:

It is clear that the variables are correlated.
Add Answer to:
1. Create A scatter Diagram for these two data sets, and find
the correlation.
How often...
For each of the data sets, create a scatter plot with the regression line and answer...
For each of the data sets, create a scatter plot with the regression line and answer these questions. What is r, r2, Critical Value (CV)? In general, what does r2 mean? What does r2 mean specifically for the data set? What is the regression equation? Is there any positive or negative correlation? Interpret b1. Interpret b0. Forecast the next year. Year Revenue ($) 1 1002 2 1108 3 967 4 1054 5 1206 6 1400
For each of the data sets, create a scatter plot with the regression line and answer...
For each of the data sets, create a scatter plot with the regression line and answer these questions. What is r, r2, Critical Value (CV)? In general, what does r2 mean? What does r2 mean specifically for the data set? What is the regression equation? Is there any positive or negative correlation? Interpret b1. Interpret b0. Forecast the next year. Year Cost (Thousands of dollars) 1 100 2 99 3 102 4 80 5 90 6 82 7 80 8...
Below are four bivariate data sets and the scatter plot for each. (Note that each scatter...
 Below are four bivariate data sets and the scatter plot for each. (Note that each scatter plot is displayed on the same scale.) Each data set is made up of sample values drawn from a population. x y 1.0 7.9 2.0 5.1 3.0 10.1 4.0 6.4 х 11 10+ 9+ 8+ 7+ 6+ 5- X X 1.0 7.3 117 10+ 2.0 9.0 9+ 3.0 7.3 8+ 7 4.0 5.6 6+ 5.0 7.9 5 4 6.0 5.3 2 7.0 4.8 5.0...
Below are four bivariate data sets and the scatter plot for each. (Note that each scatter...
 Below are four bivariate data sets and the scatter plot for each. (Note that each scatter plot is displayed on the same scale.) Each data set is made up of sample values drawn from a population. y 1.0 7.4 2.0 9.0 3.0 7.0 11 10- 11 102 9 8+ 7+ 8+ 71 61 5 5 41 4.0 5.4 5.0 7.5 6.05.2 7.0 4.5 8.0 7.1 9.0 5.5 10.0 3.9 V 1.0 8.0 2.0 6.9 3.07.3 4.0 6.1 5.0 7.4 6.0...
Below are four bivariate data sets and the scatter plot for each. (Note that each scatter...
Below are four bivariate data sets and the scatter plot for each. (Note that each scatter plot is displayed on the same scale.) Each data set is made up of sample values drawn from a population. x y 1.0 4.1 2.0 6.1 3.0 7.0 4.0 4.0 5.0 5.2 6.0 8.1 7.0 5.5 8.0 6.9 9.0 9.0 10.0 7.3 x1234567891011y12345678910110 Figure 1 u v 1.0 8.1 2.0 7.4 3.0 8.1 4.0 6.1 5.0 7.4 6.0 4.5 7.0 4.6 8.0 3.4...
I want to redraft the solution, using other words , use your own words don't copy and paste.. don...
I want to redraft the solution, using other words , use your own words don't copy and paste.. don't use handwriting.. Q1. To what extent is Hootsuite's use of social media consistent with recommendations about matching the richness of media to the situation at hand? Q2. How does Hootsuite's use of social media tend to eliminate barriers to communication? Explain. Q3. Which of the downsides to social media are occurring at Hootsuite? Explain. Q3. What are the primary benefits of...
I want to redraft the solution, using other words , use your own words don't copy...
I want to redraft the solution, using other words , use your own words don't copy and paste.. don't use handwriting.. Q1. To what extent is Hootsuite's use of social media consistent with recommendations about matching the richness of media to the situation at hand? Q2. How does Hootsuite's use of social media tend to eliminate barriers to communication? Explain. Q3. Which of the downsides to social media are occurring at Hootsuite? Explain. Q3. What are the primary benefits of...
1. Why is Google experimenting with driver-less cars? What is their revenue model for this? How...
1. Why is Google experimenting with driver-less cars? What is their revenue model for this? How will Google make money? 2. During the revolutions in Tunisia, Egypt, and Libya; the government shut down radio and TV stations. They tried to control the Internet. Which websites were used by dissidents to mount their protests? 3. Do a little research. In the past, China has tried to muzzle Google. What did Google do to enrage the Chinese government? Did Google knuckle under?...
Your company has just been hired to create an ad campaign for an online university's bachelor's...
Your company has just been hired to create an ad campaign for an online university's bachelor's degree program and you have been asked to head up the team that will be responsible for this new assignment. 1.Who will be your target audience and where will you advertise? 2.What will your message be? Will it differ based on geographic location? 3.How will you approach public relations? 4.Will you use the Internet, social networking sites, and mobile ads? Explain. Discussion Board Reminders:...
(10 points each) 1. Make a scatter plot for the following data sets: (a) x у...
 (10 points each) 1. Make a scatter plot for the following data sets: (a) x у 3 4 -2. 4 0 - 1 3 1 1 -1 3 N 6 5 Income Savings In Thousands In Thousands 28 25.1 25 29.3 34 31.4 43 27.6 48 24.8 39 25.7 74 49.5
 Below are four bivariate data sets and the scatter plot for each. (Note that each scatter plot is displayed on the same scale.) Each data set is made up of sample values drawn from a population. x y 1.0 7.9 2.0 5.1 3.0 10.1 4.0 6.4 х 11 10+ 9+ 8+ 7+ 6+ 5- X X 1.0 7.3 117 10+ 2.0 9.0 9+ 3.0 7.3 8+ 7 4.0 5.6 6+ 5.0 7.9 5 4 6.0 5.3 2 7.0 4.8 5.0...
 Below are four bivariate data sets and the scatter plot for each. (Note that each scatter plot is displayed on the same scale.) Each data set is made up of sample values drawn from a population. y 1.0 7.4 2.0 9.0 3.0 7.0 11 10- 11 102 9 8+ 7+ 8+ 71 61 5 5 41 4.0 5.4 5.0 7.5 6.05.2 7.0 4.5 8.0 7.1 9.0 5.5 10.0 3.9 V 1.0 8.0 2.0 6.9 3.07.3 4.0 6.1 5.0 7.4 6.0...
 (10 points each) 1. Make a scatter plot for the following data sets: (a) x у 3 4 -2. 4 0 - 1 3 1 1 -1 3 N 6 5 Income Savings In Thousands In Thousands 28 25.1 25 29.3 34 31.4 43 27.6 48 24.8 39 25.7 74 49.5
Most questions answered within 3 hours.
-
Where is the error in this code sequence?
String s1 = "Hello";
String s2 = "ello";...
asked 10 months ago -
Financial data for Joel de Paris, Inc., for last year
follow:
Joel de Paris, Inc.
Balance...
asked 10 months ago -
Consider this reaction:
Al2(SO4)3 (aq)+ BaCl3
(aq) Al2Cl6 (aq)- +
3BaSO4(s) . What is the...
asked 10 months ago -
Suppose that Savneet is considering increasing her
recent random sample from 20 car rentals to 40...
asked 10 months ago -
Trucks arrive at an unloading terminal at an average rate of 120
per hour.
Trucks arrive...
asked 10 months ago -
Why are methanol and ethanol completely soluble in water while
octanol is not very little soluble....
asked 10 months ago -
A facilities manager at a university reads in a research report
that the mean amount of...
asked 10 months ago -
When the CuSO4 is rehydrated by adding water to the anhydrous
compound, is this an endothermic...
asked 10 months ago -
A ray of sunlight is passing from diamond into crown glass; the
angle of incidence is...
asked 10 months ago -
A block of mass 0.249 kg is placed on top of a light, vertical
spring of...
asked 10 months ago -
how do the kidneys compensate in the presences of acidosis
a) trigger hyperventilate
b) reserve acid...
asked 10 months ago -
Question 501 pts
The rental rate of capital to the firm increases. Which of the
following...
asked 10 months ago