5. According to the 2010 US Census, the average number of residents per housing unit for the n=87 counties in Minnesota...
5. According to the 2010 US Census, the average number of residents per housing unit for the n=87 counties in Minnesota was 2.10, and the standard deviation was 0.38. Test whether the true mean number of residents per housing unit in Minnesota in 2010 is less than the national value of 2.34 at the level α = 0.05.
a. Show all five steps of this test.
b. What type of error could we be making in this context?
c. What is the minimum average number of residents per household needed in order to fail to reject H0? Assume the sample standard deviation is the same.
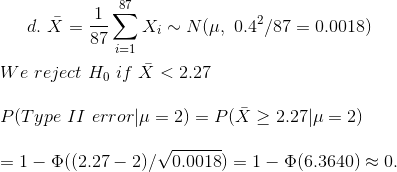
d. Suppose the true number of residents per household in Minnesota is normally distributed with a mean of 2.0 and standard deviation of 0.4. Suppose we reject null hypothesis if the sample mean number of residents is less than 2.27. What is the probability of making a type II error?
Homework Answers


The minimum average number of residents per household needed in order to fail to reject H0 =2.3123
Add Answer to:
5. According to the 2010 US Census, the average number of residents per housing unit for the n=87 counties in Minnesota...
According to the 2010 US Census, the average number of residents per housing unit for the n=87 counties in Minnesota was...
According to the 2010 US Census, the average number of residents per housing unit for the n=87 counties in Minnesota was 2.10, and the standard deviation was 0.38. Test whether the true mean number of residents per housing unit in Minnesota in 2010 is less than the national value of 2.34 at the level α = 0.05. a. Show all five steps of this test. b. What type of error could we be making in this context? c. What is...
According to the 2010 US Census, the average number of residents per housing unit for the...
According to the 2010 US Census, the average number of residents per housing unit for the n=87 counties in Minnesota was 2.10, and the standard deviation was 0.38. Test whether the true mean number of residents per housing unit in Minnesota in 2010 is less than the national value of 2.34 at the level α = 0.05. a. Show all five steps of this test. b. What type of error could we be making in this context? c. What is...
According to the 2010 US Census, the average number of residents per housingunit for the n=87...
According to the 2010 US Census, the average number of residents per housingunit for the n=87 counties in Minnesota was 2.10, and the standard deviationwas 0.38. Test whether the true mean number of residents per housing unitin Minnesota in 2010 is less than the national value of 2.34 at the levelα= 0.05.
According to the Census Bureau, 3.36 people reside in the typical American household. A sample of...
According to the Census Bureau, 3.36 people reside in the typical American household. A sample of 27 households in Arizona retirement communities showed the mean number of residents per household was 2.70 residents. The standard deviation of this sample was 1.25 residents. At the .10 significance level, is it reasonable to conclude the mean number of residents in the retirement community household is less than 3.36 persons? a. State the null hypothesis and the alternate hypothesis. (Round your answer...
According to the Census Bureau, 3.34 people reside in the typical American household. A sample of...
 According to the Census Bureau, 3.34 people reside in the typical American household. A sample of 26 households in Arizona retirement communities showed the mean number of residents per household was 2.70 residents. The standard deviation of this sample was 1.17 residents. At the 10 significance level, is it reasonable to conclude the mean number of residents in the retirement community household is less than 3.34 persons? a. State the null hypothesis and the alternate hypothesis. (Round your answer to...
Question 5 10 pts From the 2010 US Census, we learn that 14.6% of the residents...
 Question 5 10 pts From the 2010 US Census, we learn that 14.6% of the residents of Oregon speak a language other than English at home. If we take random samples size=75 and calculate the proportion of the sample that speaks a language other than English at home: Find the mean and standard deviation of the sampling distribution model for, sample proportion 2. Check if necessary conditions are met to assume a normal distribution model for Write an appropriate sampling...
According to the Carnegie unit system, the recommended number of hours students should study per unit...
According to the Carnegie unit system, the recommended number of hours students should study per unit is 2. Are statistics students' study hours less than the recommended number of hours per unit? The data show the results of a survey of 14 statistics students who were asked how many hours per unit they studied. Assume a normal distribution for the population. 0, 2.5, 0, 1.4, 2.7, 3.2, 0, 3.2, 2.5, 0.6, 1.7, 0, 3, 2.2 What can be concluded at...
Some college graduates employed full-time work more than 40 hours per week, and some work fewer...
 Some college graduates employed full-time work more than 40 hours per week, and some work fewer than 40 hours per week. We suspect that the mean number of hours worked per week by college graduates, , is different from 40 hours and wish to do a statistical test. We select a random sample of college graduates employed full-time and find that the mean of the sample is 36 hours and that the standard deviation is 3 hours. Based on this...
According to government records, the starting salary for an individual with a BA degree in Liberal...
According to government records, the starting salary for an individual with a BA degree in Liberal Arts in 2010 was $35,000 with a standard deviation of $5,000. A researcher at a small liberal arts college wants to see if the graduates at his college had higher starting salaries than the national average. A random sample of 25 students who graduated in 2010 reveals that their average starting salary was, X = $38,000. Using the data, suppose the true mean salary...
Q9- According to data from the Environmental Protection Agency, the average daily water consumption for a...
Q9- According to data from the Environmental Protection Agency, the average daily water consumption for a household of four people in the United States is at least 243 gallons. Suppose a state agency plans to test this claim using an alpha level equal to 0.05 and a random sample of 100 households with four people. Assume that the population standard deviation is known to be 40 gallons. Calculate the probability of committing a Type II error if the true population...
 According to the Census Bureau, 3.34 people reside in the typical American household. A sample of 26 households in Arizona retirement communities showed the mean number of residents per household was 2.70 residents. The standard deviation of this sample was 1.17 residents. At the 10 significance level, is it reasonable to conclude the mean number of residents in the retirement community household is less than 3.34 persons? a. State the null hypothesis and the alternate hypothesis. (Round your answer to...
 Question 5 10 pts From the 2010 US Census, we learn that 14.6% of the residents of Oregon speak a language other than English at home. If we take random samples size=75 and calculate the proportion of the sample that speaks a language other than English at home: Find the mean and standard deviation of the sampling distribution model for, sample proportion 2. Check if necessary conditions are met to assume a normal distribution model for Write an appropriate sampling...
 Some college graduates employed full-time work more than 40 hours per week, and some work fewer than 40 hours per week. We suspect that the mean number of hours worked per week by college graduates, , is different from 40 hours and wish to do a statistical test. We select a random sample of college graduates employed full-time and find that the mean of the sample is 36 hours and that the standard deviation is 3 hours. Based on this...
Most questions answered within 3 hours.
-
Where is the error in this code sequence?
String s1 = "Hello";
String s2 = "ello";...
asked 10 months ago -
Financial data for Joel de Paris, Inc., for last year
follow:
Joel de Paris, Inc.
Balance...
asked 10 months ago -
Consider this reaction:
Al2(SO4)3 (aq)+ BaCl3
(aq) Al2Cl6 (aq)- +
3BaSO4(s) . What is the...
asked 10 months ago -
Suppose that Savneet is considering increasing her
recent random sample from 20 car rentals to 40...
asked 10 months ago -
Trucks arrive at an unloading terminal at an average rate of 120
per hour.
Trucks arrive...
asked 10 months ago -
Why are methanol and ethanol completely soluble in water while
octanol is not very little soluble....
asked 10 months ago -
A facilities manager at a university reads in a research report
that the mean amount of...
asked 10 months ago -
When the CuSO4 is rehydrated by adding water to the anhydrous
compound, is this an endothermic...
asked 10 months ago -
A ray of sunlight is passing from diamond into crown glass; the
angle of incidence is...
asked 10 months ago -
A block of mass 0.249 kg is placed on top of a light, vertical
spring of...
asked 10 months ago -
how do the kidneys compensate in the presences of acidosis
a) trigger hyperventilate
b) reserve acid...
asked 10 months ago -
Question 501 pts
The rental rate of capital to the firm increases. Which of the
following...
asked 10 months ago