Based on the frequency distribution above, find the relative frequency for the class with lower class limit 31.
1.

Based on the frequency distribution above, find the relative frequency for the class with lower class limit 31.
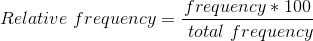
Relative Frequency = _______ %
2.
Based on the frequency distribution above, find the cumulative frequency for the class with lower class limit 31.

Cumulative Frequency = _______
Homework Answers

Frequency for the class with lower class 31 is = 9
total of frequency = 2+4+8+8+9+2 = 33
| Ages | Number of student |
| 15-18 | 2 |
| 19-22 | 4 |
| 23 - 26 | 8 |
| 27-30 | 8 |
| 31-34 | 9 |
| 35-38 | 2 |

We Round the relative frequency up to 1 decimal place

Answer :-

Now next part
For cumulative frequency we add all the previous frequency including those class frequency
| Ages | Number of student | Cumulative frequency |
| 15-18 | 6 | 6 |
| 19-22 | 10 | = 6 + 10 = 16 |
| 23 - 26 | 3 | = 6 + 10 + 3 = 19 |
| 27-30 | 2 | = 6 + 10 + 3 + 2 = 21 |
| 31-34 | 5 | = 6 + 10 + 3 + 2+ 5 =26 |
| 35-38 | 7 | = 6 + 10 + 3 + 2+ 5 + 7 =33 |
Cumulative frequency for the class with Lower limit = 26
Final answer :
Cumulative frequency = 26
Add Answer to:
Based on the frequency distribution above, find the relative frequency for the class with lower class limit 31.
Based on the frequency distribution above, find the relative frequency for the class with lower class limit 27.
AgesNumber of students15-18919-22223-26227-30831-341035-3810Based on the frequency distribution above, find the relative frequency for the class with lower class limit 27.Relative Frequency = _______ %
Based on the frequency distribution above, find the relative frequency for the class with lower class limit 23.
 Based on the frequency distribution above, find the relative frequency for the class with lower class limit 23. Relative Frequency = _______ %
Based on the frequency distribution above, find the relative frequency for the class with lower class limit 35.
AgesNumber of students15-18819-22923-26727-301031-34535-385Based on the frequency distribution above, find the relative frequency for the class with lower class limit 35. Relative Frequency = _______ Give your answer as a percent, rounded to one decimal place
Based on the frequency distribution above, find the relative frequency for the class 35-38
AgesNumber of students15-18619-221023-261027-30231-34635-384Based on the frequency distribution above, find the relative frequency for the class 35-38. Relative Frequency = _______ % Give your answer as a percent, rounded to one decimal place
Based on the frequency distribution above, is 19 a: Please, anyone, help me and please explain...
 Based on the frequency distribution above, is 19 a:
Please, anyone, help me and please explain step by step the
solution :D
Ages Number of students 15-18 19-22 23-26 27-30 31-34 35-38 4 8 6 3 Based on the frequency distribution above, is 19 a: Class midpoint Class width Class boundary Upper class limit Lower class limit
Based on the frequency distribution above, is 19 a:
Please, anyone, help me and please explain step by step the
solution :D
Ages Number of students 15-18 19-22 23-26 27-30 31-34 35-38 4 8 6 3 Based on the frequency distribution above, is 19 a: Class midpoint Class width Class boundary Upper class limit Lower class limit
construct a frequency distribution using a class width of 10, and using 30.0 as the lower...
 construct a frequency distribution using a class width of 10, and
using 30.0 as the lower class limit for the first class.
Part 1 out of 3 Construct a frequency distribution using a class width of 10, and using 30.0 as the lower class limit for the first class. Prize ($1000s) Frequency
Part 1 out of 3 Construct a frequency distribution using a class width of 10, and using 30.0 as the lower class limit for the first class. Prize...
construct a frequency distribution using a class width of 10, and
using 30.0 as the lower class limit for the first class.
Part 1 out of 3 Construct a frequency distribution using a class width of 10, and using 30.0 as the lower class limit for the first class. Prize ($1000s) Frequency
Part 1 out of 3 Construct a frequency distribution using a class width of 10, and using 30.0 as the lower class limit for the first class. Prize...
Make a frequency distribution using the first lower class limit = 16 and the class width...
Make a frequency distribution using the first lower class limit = 16 and the class width = 7 Data Set : 36, 34, 32, 34, 45, 41, 16, 38, 28, 41, 36
find the class limits. the first lower class limit is 28 Source: The Complete Food Counts...
 find the class limits. the first lower class limit is 28
Source: The Complete Food Counts Part 1 What is the class width for a frequency distribution with 5 classes? The class width is 4 Part 2 out of 5 Find the class limits. The first lower class limit is 28. Class limits 28 Tutorial help Print this pags only Plugin not installed or missing? Show More
find the class limits. the first lower class limit is 28
Source: The Complete Food Counts Part 1 What is the class width for a frequency distribution with 5 classes? The class width is 4 Part 2 out of 5 Find the class limits. The first lower class limit is 28. Class limits 28 Tutorial help Print this pags only Plugin not installed or missing? Show More
Weight in PoundsNumber of Newborns 3-4 5-6 7-8 9-10 11-12 13-14 9 Based on the frequency...
 Weight in PoundsNumber of Newborns 3-4 5-6 7-8 9-10 11-12 13-14 9 Based on the frequency distribution above, find the cumulative frequency for the class with lower class limit 11 Cumulative Frequency Give your answer rounded to one decimal place Points possible: 2 This is attempt 1 of t.
Please set up and fill in ALL of the CLASS, Frequency, Midpoint, Relative Frequency & Cumulative...
 Please set up and fill in ALL of the CLASS, Frequency, Midpoint,
Relative Frequency & Cumulative Frequency for the Frequency
distribution shown.
I need the entire graph with the midpoint, relative frequency
and cumulative frequency completed for all of the classes, not just
for the 20-30 class.
Use the frequency distribution shown below to construct an expanded frequency distribution High Temperatures (F) 20-30 31-41 42-52 [ 53-63 64-74 75-85 86-96 Class 23 Frequency, f18 45 6667 8066 Complete the table...
Please set up and fill in ALL of the CLASS, Frequency, Midpoint,
Relative Frequency & Cumulative Frequency for the Frequency
distribution shown.
I need the entire graph with the midpoint, relative frequency
and cumulative frequency completed for all of the classes, not just
for the 20-30 class.
Use the frequency distribution shown below to construct an expanded frequency distribution High Temperatures (F) 20-30 31-41 42-52 [ 53-63 64-74 75-85 86-96 Class 23 Frequency, f18 45 6667 8066 Complete the table...
 Based on the frequency distribution above, is 19 a:
Please, anyone, help me and please explain step by step the
solution :D
Ages Number of students 15-18 19-22 23-26 27-30 31-34 35-38 4 8 6 3 Based on the frequency distribution above, is 19 a: Class midpoint Class width Class boundary Upper class limit Lower class limit
Based on the frequency distribution above, is 19 a:
Please, anyone, help me and please explain step by step the
solution :D
Ages Number of students 15-18 19-22 23-26 27-30 31-34 35-38 4 8 6 3 Based on the frequency distribution above, is 19 a: Class midpoint Class width Class boundary Upper class limit Lower class limit
 construct a frequency distribution using a class width of 10, and
using 30.0 as the lower class limit for the first class.
Part 1 out of 3 Construct a frequency distribution using a class width of 10, and using 30.0 as the lower class limit for the first class. Prize ($1000s) Frequency
Part 1 out of 3 Construct a frequency distribution using a class width of 10, and using 30.0 as the lower class limit for the first class. Prize...
construct a frequency distribution using a class width of 10, and
using 30.0 as the lower class limit for the first class.
Part 1 out of 3 Construct a frequency distribution using a class width of 10, and using 30.0 as the lower class limit for the first class. Prize ($1000s) Frequency
Part 1 out of 3 Construct a frequency distribution using a class width of 10, and using 30.0 as the lower class limit for the first class. Prize...
 find the class limits. the first lower class limit is 28
Source: The Complete Food Counts Part 1 What is the class width for a frequency distribution with 5 classes? The class width is 4 Part 2 out of 5 Find the class limits. The first lower class limit is 28. Class limits 28 Tutorial help Print this pags only Plugin not installed or missing? Show More
find the class limits. the first lower class limit is 28
Source: The Complete Food Counts Part 1 What is the class width for a frequency distribution with 5 classes? The class width is 4 Part 2 out of 5 Find the class limits. The first lower class limit is 28. Class limits 28 Tutorial help Print this pags only Plugin not installed or missing? Show More
 Weight in PoundsNumber of Newborns 3-4 5-6 7-8 9-10 11-12 13-14 9 Based on the frequency distribution above, find the cumulative frequency for the class with lower class limit 11 Cumulative Frequency Give your answer rounded to one decimal place Points possible: 2 This is attempt 1 of t.
 Please set up and fill in ALL of the CLASS, Frequency, Midpoint,
Relative Frequency & Cumulative Frequency for the Frequency
distribution shown.
I need the entire graph with the midpoint, relative frequency
and cumulative frequency completed for all of the classes, not just
for the 20-30 class.
Use the frequency distribution shown below to construct an expanded frequency distribution High Temperatures (F) 20-30 31-41 42-52 [ 53-63 64-74 75-85 86-96 Class 23 Frequency, f18 45 6667 8066 Complete the table...
Please set up and fill in ALL of the CLASS, Frequency, Midpoint,
Relative Frequency & Cumulative Frequency for the Frequency
distribution shown.
I need the entire graph with the midpoint, relative frequency
and cumulative frequency completed for all of the classes, not just
for the 20-30 class.
Use the frequency distribution shown below to construct an expanded frequency distribution High Temperatures (F) 20-30 31-41 42-52 [ 53-63 64-74 75-85 86-96 Class 23 Frequency, f18 45 6667 8066 Complete the table...
Most questions answered within 3 hours.
-
Where is the error in this code sequence?
String s1 = "Hello";
String s2 = "ello";...
asked 10 months ago -
Financial data for Joel de Paris, Inc., for last year
follow:
Joel de Paris, Inc.
Balance...
asked 10 months ago -
Consider this reaction:
Al2(SO4)3 (aq)+ BaCl3
(aq) Al2Cl6 (aq)- +
3BaSO4(s) . What is the...
asked 10 months ago -
Suppose that Savneet is considering increasing her
recent random sample from 20 car rentals to 40...
asked 10 months ago -
Trucks arrive at an unloading terminal at an average rate of 120
per hour.
Trucks arrive...
asked 10 months ago -
Why are methanol and ethanol completely soluble in water while
octanol is not very little soluble....
asked 10 months ago -
A facilities manager at a university reads in a research report
that the mean amount of...
asked 10 months ago -
When the CuSO4 is rehydrated by adding water to the anhydrous
compound, is this an endothermic...
asked 10 months ago -
A ray of sunlight is passing from diamond into crown glass; the
angle of incidence is...
asked 10 months ago -
A block of mass 0.249 kg is placed on top of a light, vertical
spring of...
asked 10 months ago -
how do the kidneys compensate in the presences of acidosis
a) trigger hyperventilate
b) reserve acid...
asked 10 months ago -
Question 501 pts
The rental rate of capital to the firm increases. Which of the
following...
asked 10 months ago