The government is considering levying a tax of $80 per unit on suppliers of either leather jackets or smartphones. The supply curve for each of these two goods is identical, as you can see on each of the following graphs. The demand for leather jackets is
The government is considering levying a tax of $80 per unit on suppliers of either leather jackets or smartphones. The supply curve for each of these two goods is identical, as you can see on each of the following graphs. The demand for leather jackets is shown by DL (on the first graph), and the demand for smartphones is shown by Ds (on the second graph).
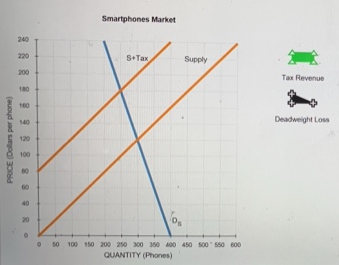
Suppose the government taxes leather jackets. The following graph shows the annual supply and demand for this good. It also shows the supply curve (S + Taz) shifted up by the amount of the proposed tax ($80 per jacket).
On the following graph, use the green rectangle (triangle symbols) to shade the area that represents tax revenue for leather jackets. Then use the black triangle (plus symbols) to shade the area that represents the deadweight loss associated with the tax.
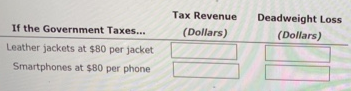
Complete the following table with the tax revenue collected and deadweight loss caused by each of the tax proposals.
Suppose the government wants to tax the good that will generate more tax revenue at a lower welfare cost. In this case, it should tax _______ because, all else held constant, taxing a good with a relatively
_______ elastic demand generates larger tax revenue and smaller deadweight loss.
Homework Answers

Add Answer to:
The government is considering levying a tax of $80 per unit on suppliers of either leather jackets or smartphones. The supply curve for each of these two goods is identical, as you can see on each of the following graphs. The demand for leather jackets is
The government is considering levying a tax of $100 per unit on suppliers of either leather jackets or smartphones.
 3. Relationship between tax revenues, deadweight loss, and demandelasticity The government is considering levying a tax of $100 per unit on suppliers of either leather jackets or smartphones. The supply curve for each of these two goods is identical, as you can see on each of the following graphs. The demand for leather jackets is shown by DL (on the first graph), and the demand for smartphones is shown by Ds (on the second graph). Suppose the government taxes leather jackets. The...
levying a tax of $100 per unit on The qovernment is consid suppliers of either leather...
 levying a tax of $100 per unit on The qovernment is consid suppliers of either leather jackets ór smartphones. The supply curve for each of these two goods is identical, as each of the following graphs. The demand for leather jackets is shown by Di (on the first graph), and the demand for smartphones is shown by Ds (on the second graph) Suppose the government taxes leather jackets. The followin graph shows the annual supply and demand for this good...
The government is considering levying a tax of $60 per unit on suppliers of either concert...
 The government is considering levying a tax of $60 per unit on suppliers of either concert tickets or bus passes. The supply curve for each of these two goods is identical, as you can see on each of the following graphs. The demand for concert tickets is shown by De (on the first graph), and the demand for bus passes is shown by D. (on the second graph). Suppose the government taxes concert tickets. The following graph shows the annual...
The government is considering levying a tax of $60 per unit onsuppliers of either concert...
 The government is considering levying a tax of $60 per unit on
suppliers of either concert tickets or bus passes. The supply curve
for each of these two goods is identical, as you can see on each of
the following graphs. The demand for concert tickets is shown
by (on the first graph),
and the demand for bus passes is shown by (on the second
graph).Suppose the government taxes concert tickets. The following
graph shows the annual supply and demand for this...
The government is considering levying a tax of $60 per unit on
suppliers of either concert tickets or bus passes. The supply curve
for each of these two goods is identical, as you can see on each of
the following graphs. The demand for concert tickets is shown
by (on the first graph),
and the demand for bus passes is shown by (on the second
graph).Suppose the government taxes concert tickets. The following
graph shows the annual supply and demand for this...
3. Relationship between tax revenues, deadweight loss, and demandelasticity The government is considering levying a tax...
 3. Relationship between tax revenues, deadweight loss, and demandelasticity The government is considering levying a tax of $120 per unit on suppliers of either leather jackets or smartphones. The supply curve for each of these two goods is identical, as you can see on each of the following graphs. The demand for leather jackets is shown by Di (on the first graph), and the demand for smartphones is shown by Ds (on the second graph). Suppose the government taxes leather...
3. Relationship between tax revenues, deadweight loss, and demandelasticity The government is considering levying a tax...
 3. Relationship between tax revenues, deadweight loss, and demandelasticity The government is considering levying a tax of $60 per unit on suppliers of either concert tickets or bus passes. The supply curve for each of these two goods is identical, as you can see on each of the following graphs. The demand for concert tickets is shown by Dc (on the first graph), and the demand for bus passes is shown by DB (on the second graph). Suppose the government...
Complete the following table with the tax revenue collected and deadweight loss caused by each of the tax proposals.
 3. Relationship between tax revenues, deadweight loss, and demand elasticityThe government is considering levying a tax of $60 per unit on suppliers of either concert tickets or bus passes. The supply curve for each of these two goods is identical, as you can see on each of the following graphs. The demand for concert tickets is shown by DC (on the first graph), and the demand for bus passes is shown by DB (on the second graph).Suppose the government taxes...
Homework (Ch 08) 3. Relationship between tax revenues, deadweight loss, and demandelasticity The government is considering...
 Homework (Ch 08) 3. Relationship between tax revenues, deadweight loss, and demandelasticity The government is considering levying a tax of $60 per unit on suppliers of either concert tickets or bus passes. The supply curve for each of these two goods is identical, as you can see on each of the following graphs. The demand for concert tickets is shown by Dc (on the first graph), and the demand for bus passes is shown by Ds (on the second graph)....
in this case it should tax (concert tickets, bus passes) With a relatively (less, more) 3....
 in
this case it should tax (concert tickets, bus passes)
With a relatively (less, more)
3. Relationship between tax revenues, deadweight loss, and demand elasticity The government is considering levying a tax of $60 per unit on suppliers of either concert tickets or bus passes. The supply curve for each of these two goods is identical, as you can see on each of the following graphs. The demand for concert tickets is shown by Dc (on the first graph), and...
in
this case it should tax (concert tickets, bus passes)
With a relatively (less, more)
3. Relationship between tax revenues, deadweight loss, and demand elasticity The government is considering levying a tax of $60 per unit on suppliers of either concert tickets or bus passes. The supply curve for each of these two goods is identical, as you can see on each of the following graphs. The demand for concert tickets is shown by Dc (on the first graph), and...
The government is considering levying a tax of $50 per unit on suppliers of either concert...
The government is considering levying a tax of $50 per unit on suppliers of either concert tickets or bus passes. The supply curve for each of these two goods is identical, as you can see on each of the following graphs. The demand for concert tickets is shown by (on the first graph), and the demand for bus passes is shown by (on the second graph).
 levying a tax of $100 per unit on The qovernment is consid suppliers of either leather jackets ór smartphones. The supply curve for each of these two goods is identical, as each of the following graphs. The demand for leather jackets is shown by Di (on the first graph), and the demand for smartphones is shown by Ds (on the second graph) Suppose the government taxes leather jackets. The followin graph shows the annual supply and demand for this good...
 The government is considering levying a tax of $60 per unit on suppliers of either concert tickets or bus passes. The supply curve for each of these two goods is identical, as you can see on each of the following graphs. The demand for concert tickets is shown by De (on the first graph), and the demand for bus passes is shown by D. (on the second graph). Suppose the government taxes concert tickets. The following graph shows the annual...
 The government is considering levying a tax of $60 per unit on
suppliers of either concert tickets or bus passes. The supply curve
for each of these two goods is identical, as you can see on each of
the following graphs. The demand for concert tickets is shown
by (on the first graph),
and the demand for bus passes is shown by (on the second
graph).Suppose the government taxes concert tickets. The following
graph shows the annual supply and demand for this...
The government is considering levying a tax of $60 per unit on
suppliers of either concert tickets or bus passes. The supply curve
for each of these two goods is identical, as you can see on each of
the following graphs. The demand for concert tickets is shown
by (on the first graph),
and the demand for bus passes is shown by (on the second
graph).Suppose the government taxes concert tickets. The following
graph shows the annual supply and demand for this...
 3. Relationship between tax revenues, deadweight loss, and demandelasticity The government is considering levying a tax of $120 per unit on suppliers of either leather jackets or smartphones. The supply curve for each of these two goods is identical, as you can see on each of the following graphs. The demand for leather jackets is shown by Di (on the first graph), and the demand for smartphones is shown by Ds (on the second graph). Suppose the government taxes leather...
 3. Relationship between tax revenues, deadweight loss, and demandelasticity The government is considering levying a tax of $60 per unit on suppliers of either concert tickets or bus passes. The supply curve for each of these two goods is identical, as you can see on each of the following graphs. The demand for concert tickets is shown by Dc (on the first graph), and the demand for bus passes is shown by DB (on the second graph). Suppose the government...
 Homework (Ch 08) 3. Relationship between tax revenues, deadweight loss, and demandelasticity The government is considering levying a tax of $60 per unit on suppliers of either concert tickets or bus passes. The supply curve for each of these two goods is identical, as you can see on each of the following graphs. The demand for concert tickets is shown by Dc (on the first graph), and the demand for bus passes is shown by Ds (on the second graph)....
 in
this case it should tax (concert tickets, bus passes)
With a relatively (less, more)
3. Relationship between tax revenues, deadweight loss, and demand elasticity The government is considering levying a tax of $60 per unit on suppliers of either concert tickets or bus passes. The supply curve for each of these two goods is identical, as you can see on each of the following graphs. The demand for concert tickets is shown by Dc (on the first graph), and...
in
this case it should tax (concert tickets, bus passes)
With a relatively (less, more)
3. Relationship between tax revenues, deadweight loss, and demand elasticity The government is considering levying a tax of $60 per unit on suppliers of either concert tickets or bus passes. The supply curve for each of these two goods is identical, as you can see on each of the following graphs. The demand for concert tickets is shown by Dc (on the first graph), and...
Most questions answered within 3 hours.
-
Where is the error in this code sequence?
String s1 = "Hello";
String s2 = "ello";...
asked 11 months ago -
Financial data for Joel de Paris, Inc., for last year
follow:
Joel de Paris, Inc.
Balance...
asked 11 months ago -
Consider this reaction:
Al2(SO4)3 (aq)+ BaCl3
(aq) Al2Cl6 (aq)- +
3BaSO4(s) . What is the...
asked 11 months ago -
Suppose that Savneet is considering increasing her
recent random sample from 20 car rentals to 40...
asked 11 months ago -
Trucks arrive at an unloading terminal at an average rate of 120
per hour.
Trucks arrive...
asked 11 months ago -
Why are methanol and ethanol completely soluble in water while
octanol is not very little soluble....
asked 11 months ago -
A facilities manager at a university reads in a research report
that the mean amount of...
asked 11 months ago -
When the CuSO4 is rehydrated by adding water to the anhydrous
compound, is this an endothermic...
asked 11 months ago -
A ray of sunlight is passing from diamond into crown glass; the
angle of incidence is...
asked 11 months ago -
A block of mass 0.249 kg is placed on top of a light, vertical
spring of...
asked 11 months ago -
how do the kidneys compensate in the presences of acidosis
a) trigger hyperventilate
b) reserve acid...
asked 11 months ago -
Question 501 pts
The rental rate of capital to the firm increases. Which of the
following...
asked 11 months ago