Suppose Barefeet is a monopolist that produces and sells Ooh boots, an amazingly trendy brand with...
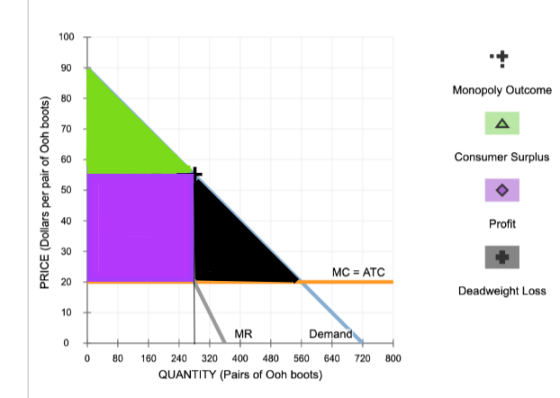
Suppose Barefeet is a monopolist that produces and sells Ooh boots, an amazingly trendy brand with no close substitutes. The following graph shows the market demand and marginal revenue (MR) curves Barefeet faces, as well as its marginal cost (MC), which is constant at $20 per pair of Ooh boots. For simplicity, assume that fixed costs are equal to zero; this, combined with the fact that Barefeet's marginal cost is constant, means that its marginal cost curve is also equal to the average total cost (ATC) curve.
First, suppose that Barefeet cannot price discriminate. That is, it must charge each consumer the same price for Ooh boots regardless of the consumer's willingness and ability to pay.
On the following graph, use the black point (plus symbol) to indicate the profit-maximizing price and quantity. Next, use the purple points (diamond symbol) to shade the profit, the green points (triangle symbol) to shade the consumer surplus, and the black points (plus symbol) to shade the deadweight loss in this market without price discrimination. (Note: If you decide that consumer surplus, profit, or deadweight loss equals zero, indicate this by leaving that element in its original position on the palette.)

Now, suppose that Barefeet can practice perfect price discrimination—that is, it knows each consumer's willingness to pay for each pair of Ooh boots and is able to charge each consumer that amount.
On the following graph, use the black point (plus symbol) to indicate the profit-maximizing quantity sold and the lowest price at which the firm sells its boots. Next, use the purple points (diamond symbol) to shade the profit, the green points (triangle symbol) to shade the consumer surplus, and the black points (plus symbol) to shade the deadweight loss in this market with perfect price discrimination. (Note: If you decide that consumer surplus, profit, or deadweight loss equals zero, indicate this by leaving that element in its original position on the palette.)

Consider the welfare effects when the industry operates under a monopoly and cannot price discriminate versus when it can price discriminate.
Complete the following table by indicating under which market conditions each of the statements is true. (Note: If the statement isn't true for either single-price monopolies or perfect price discrimination, leave the entire row unchecked.) Check all that apply.
| Statement | Single-price Monopoly | Perfect Price Discrimination |
| There is no deadweight loss associated with the profit-maximizing output. | ||
| Total surplus is not maximized. | ||
| Barefeet produces the efficient quantity of Ooh boots. |
Homework Answers
At monopoly, MR = MC
So graph
In Perfect price DISCRIMINATION,
P = MC
So , Monopolist extracts entire CS as his profits
So, CS = 0, deadweight loss = 0
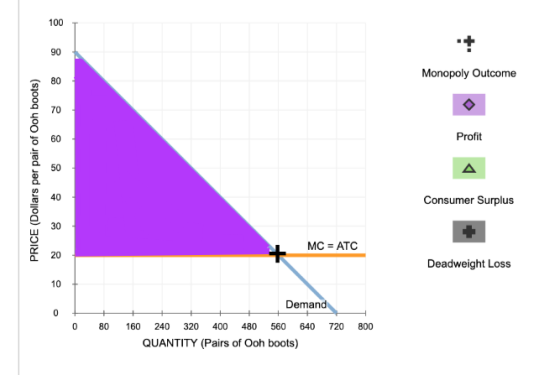
Table :
| MONOPOLY | price DISCRIMINATION | |
| No deadweight loss | ✓ | |
| Total Surplus not maximized | ✓ | |
| Effecient Quantity | ✓ |
Add Answer to:
Suppose Barefeet is a monopolist that produces and sells Ooh boots, an amazingly trendy brand with...
Suppose Barefeet is a monopolist that produces and sells Ooh boots, an amazingly trendy brand with no close substitutes.
 7. Price discrimination and welfare Suppose Barefeet is a monopolist that produces and sells Ooh boots, an amazingly trendy brand with no close substitutes. The following graph shows the market demand and marginal revenue (MR) curves Barefeet faces, as well as its marginal cost (MC), which is constant at $30 per pair of Ooh boots. For simplicity, assume that fixed costs are equal to zero; this, combined with the fact that Barefeet's marginal cost is constant, means that its marginal cost...
Imagine Barefeet is a monopolist that produces and sells Ooh boots, an amazingly trendy brand with no close substitutes.
 7. Price discrimination and welfare Imagine Barefeet is a monopolist that produces and sells Ooh boots, an amazingly trendy brand with no close substitutes. The following graph shows the market demand and marginal revenue (MR) curves Barefeet faces, as well as its marginal cost (MC), which is constant at $40 per pair of Ooh boots. For simplicity, assume that fixed costs are equal to zero; this, combined with the fact that Barefeet's marginal cost is constant, means that its marginal cost...
Barefeet is a monopolist that produces Ooh boots, an amazingly trendy brand with no close substitutes.
 6. Price discrimination and welfare Barefeet is a monopolist that produces Ooh boots, an amazingly trendy brand with no close substitutes. The following graph shows the market demand and marginal revenue curves Barefeet faces, as well as its marginal cost curve, which is constant at $40 per pair of Ooh boots. For simplicity, assume that fixed costs are equal to zero; this, combined with the fact that the firm's marginal cost (MC) is constant, means that its marginal cost curve is...
On the following graph, use the black point (plus symbol) to indicate the profit-maximizing quantity sold and the lowest price at which the firm sells its boots.
 On the following graph, use the black point (plus symbol) to indicate the profit-maximizing quantity sold and the lowest price at which the firm sells its boots. Next, use the purple points (diamond symbol) to shade the profit, the green points (triangle symbol) to shade the consumer surplus, and the black points (white plus symbol) to shade the deadweight loss in this market with perfect price discrimination. (Note: If you decide that consumer surplus, profit, or deadweight loss equals zero,...
Action Systems is a monopolist that is the only seller of the world's most popular gaming...
 Action Systems is a monopolist that is the only seller of the world's most popular gaming system. The following graph shows the market demand and marginal revenue curves Action Systems faces, as well as its marginal cost curve, which is constant at $40 per console. For simplicity, assume that fixed costs are equal to zero; this, combined with the fact that the firm's marginal cost (MC) is constant, means that its marginal cost curve is also equal to the average...
A small town is served by many competing supermarkets, which all have the same constant marginal...
 A small town is served by many competing supermarkets, which all have the same constant marginal cost.
Use the black point (plus symbol) to show the competitive price and quantity in this market. Then use the green area (triangle symbol) to shade the area representing consumer surplus in the market for groceries, and use the purple area (diamond symbol) to shade the area representing producer surplus.
Now suppose that the independent supermarkets combine into one chain.
Use the black point...
A small town is served by many competing supermarkets, which all have the same constant marginal cost.
Use the black point (plus symbol) to show the competitive price and quantity in this market. Then use the green area (triangle symbol) to shade the area representing consumer surplus in the market for groceries, and use the purple area (diamond symbol) to shade the area representing producer surplus.
Now suppose that the independent supermarkets combine into one chain.
Use the black point...
BYOB is a monopolist in beer production and distribution in the imaginary economy of Hopsville
 3. Profit maximization and loss minimization BYOB is a monopolist in beer production and distribution in the imaginary economy of Hopsville. Suppose that BYOB cannot price- discriminate; that is, it sells its beer at the same price per can to all customers. The following graph shows the marginal cost (MC), marginal revenue (MR), average cost (AC), and demand (D) for beer in this market. Place the black point (plus symbol) on the graph to indicate the profit-maximizing price and quantity for BYOB....
5. Monopoly outcome versus competition outcome Consider thedaily market for hot dogs in a small...
 5. Monopoly outcome versus competition outcome Consider the
daily market for hot dogs in a small city. Suppose that this market
is in long-run competitive equilibrium with many hot dog stands in
the city, each one selling the same kind of hot dogs. Therefore,
each vendor is a price taker and possesses no market power. The
following graph shows the demand (D) and supply curves (S = MC) in
the market for hot dogs. Place the black point (plus symbol) on...
5. Monopoly outcome versus competition outcome Consider the
daily market for hot dogs in a small city. Suppose that this market
is in long-run competitive equilibrium with many hot dog stands in
the city, each one selling the same kind of hot dogs. Therefore,
each vendor is a price taker and possesses no market power. The
following graph shows the demand (D) and supply curves (S = MC) in
the market for hot dogs. Place the black point (plus symbol) on...
Profit maximization and loss minimization BYOB is a monopolist in beer production and distribution in the imaginary economy of Hopsville. Suppose that BYOB cannot price discriminate; that is, it sells its beer at the same price per can to all customers. T
 . Profit maximization and loss minimizationBYOB is a monopolist in beer production and distribution in the imaginary economy of Hopsville. Suppose that BYOB cannot price discriminate; that is, it sells its beer at the same price per can to all customers. The following graph shows the marginal cost (MC), marginal revenue (MR), average total cost (ATC), and demand (D) for beer in this market.Place the black point (plus symbol) on the graph to indicate the profit-maximizing price and quantity for...
BYOB is a monopolist in beer production and distribution in the imaginary economy of Hopsville. Suppose that BYOB cannot price discriminate;
 11. Profit maximization and loss minimization BYOB is a monopolist in beer production and distribution in the imaginary economy of Hopsville. Suppose that BYOB cannot price discriminate; that is, it sells its beer at the same price per can to all customers. The following graph shows the marginal cost (MC), marginal revenue (MR), average total cost (ATC), and demand (D) for beer in this market. Place the black point (plus symbol) on the graph to indicate the profit-maximizing price and quantity for...
 7. Price discrimination and welfare Suppose Barefeet is a monopolist that produces and sells Ooh boots, an amazingly trendy brand with no close substitutes. The following graph shows the market demand and marginal revenue (MR) curves Barefeet faces, as well as its marginal cost (MC), which is constant at $30 per pair of Ooh boots. For simplicity, assume that fixed costs are equal to zero; this, combined with the fact that Barefeet's marginal cost is constant, means that its marginal cost...
 Action Systems is a monopolist that is the only seller of the world's most popular gaming system. The following graph shows the market demand and marginal revenue curves Action Systems faces, as well as its marginal cost curve, which is constant at $40 per console. For simplicity, assume that fixed costs are equal to zero; this, combined with the fact that the firm's marginal cost (MC) is constant, means that its marginal cost curve is also equal to the average...
 A small town is served by many competing supermarkets, which all have the same constant marginal cost.
Use the black point (plus symbol) to show the competitive price and quantity in this market. Then use the green area (triangle symbol) to shade the area representing consumer surplus in the market for groceries, and use the purple area (diamond symbol) to shade the area representing producer surplus.
Now suppose that the independent supermarkets combine into one chain.
Use the black point...
A small town is served by many competing supermarkets, which all have the same constant marginal cost.
Use the black point (plus symbol) to show the competitive price and quantity in this market. Then use the green area (triangle symbol) to shade the area representing consumer surplus in the market for groceries, and use the purple area (diamond symbol) to shade the area representing producer surplus.
Now suppose that the independent supermarkets combine into one chain.
Use the black point...
Most questions answered within 3 hours.
-
Where is the error in this code sequence?
String s1 = "Hello";
String s2 = "ello";...
asked 11 months ago -
Financial data for Joel de Paris, Inc., for last year
follow:
Joel de Paris, Inc.
Balance...
asked 11 months ago -
Consider this reaction:
Al2(SO4)3 (aq)+ BaCl3
(aq) Al2Cl6 (aq)- +
3BaSO4(s) . What is the...
asked 11 months ago -
Suppose that Savneet is considering increasing her
recent random sample from 20 car rentals to 40...
asked 11 months ago -
Trucks arrive at an unloading terminal at an average rate of 120
per hour.
Trucks arrive...
asked 11 months ago -
Why are methanol and ethanol completely soluble in water while
octanol is not very little soluble....
asked 11 months ago -
A facilities manager at a university reads in a research report
that the mean amount of...
asked 11 months ago -
When the CuSO4 is rehydrated by adding water to the anhydrous
compound, is this an endothermic...
asked 11 months ago -
A ray of sunlight is passing from diamond into crown glass; the
angle of incidence is...
asked 11 months ago -
A block of mass 0.249 kg is placed on top of a light, vertical
spring of...
asked 11 months ago -
how do the kidneys compensate in the presences of acidosis
a) trigger hyperventilate
b) reserve acid...
asked 11 months ago -
Question 501 pts
The rental rate of capital to the firm increases. Which of the
following...
asked 11 months ago