The monthly sales for Telco Batteries Inc. were as follows:
Problem # 1
The monthly sales for Telco Batteries Inc. were as follows:
Sales
Month (000 units)
January 20
February 21
March 15
April 14
May 13
June 16
July 17
August 18
September 20
October 20
November 21
December 23
Plot the monthly sales data.
Forecast coming January sales using each of the following:
The naïve approach
A 6-month moving average
A 6-month weighted average using 0.1, 0.1, 0.1, 0.2, 0.2 and 0.3, with the heaviest weights applied to the most recent months.
Calculate the mean absolute deviation (MAD) and the mean squared error (MSE) for each of the method above. Which is better among the three methods?
Homework Answers
a. Monthly sales data -
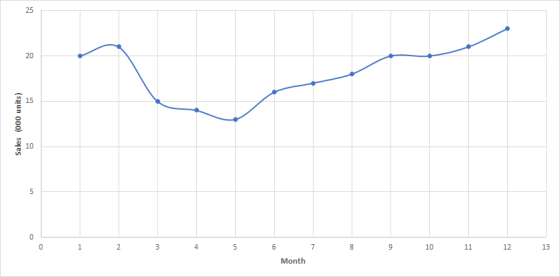
b. Below are the forecasts for all 3 methods -
| Naive | Six month Moving Average | Six month Moving Average | |||||||||||
| Month | Sales (000 units) | Forecast | Error | Absolute error | Error Square | Forecast | Error | Absolute error | Error Square | Forecast | Error | Absolute error | Error Square |
| Jan | 20 | ||||||||||||
| Feb | 21 | 20 | 1 | 1 | 1 | ||||||||
| March | 15 | 21 | -6 | 6 | 36 | ||||||||
| April | 14 | 15 | -1 | 1 | 1 | ||||||||
| May | 13 | 14 | -1 | 1 | 1 | ||||||||
| June | 16 | 13 | 3 | 3 | 9 | ||||||||
| July | 17 | 16 | 1 | 1 | 1 | 16.5 | 0.5 | 0.5 | 0.25 | 15.8 | 1.2 | 1.2 | 1.44 |
| August | 18 | 17 | 1 | 1 | 1 | 16 | 2 | 2 | 4 | 15.9 | 2.1 | 2.1 | 4.41 |
| September | 20 | 18 | 2 | 2 | 4 | 15.5 | 4.5 | 4.5 | 20.25 | 16.2 | 3.8 | 3.8 | 14.44 |
| October | 20 | 20 | 0 | 0 | 0 | 16.33 | 3.67 | 3.67 | 13.44 | 17.30 | 2.70 | 2.70 | 7.29 |
| November | 21 | 20 | 1 | 1 | 1 | 17.33 | 3.67 | 3.67 | 13.44 | 18.20 | 2.80 | 2.80 | 7.84 |
| December | 23 | 21 | 2 | 2 | 4 | 18.67 | 4.33 | 4.33 | 18.78 | 19.40 | 3.60 | 3.60 | 12.96 |
| MAD = | 1.73 | MAD = | 3.11 | MAD = | 2.70 | ||||||||
| MSE= | 5.36 | MSE= | 11.69 | MSE= | 8.06 | ||||||||
And below are the formulas that are used -

![A B K M Six month Moving Average (with weights) 1 2 Month Sales (000 units] Forecast Absolute error Error Square Error 20 3 J](http://img.homeworklib.com/images/e39b8222-a54a-4c0d-be68-24738efe6a4b.png?x-oss-process=image/resize,w_560)
c. Mean absolute deviation and Mean Square error has already been calculated above. Mean absolute deviation and Mean squared error is minimum for Naive forecast. Hence naive forecast gives better forecasts than other two methods.
The monthly sales for Telco Batteries Inc., were as follows: Month Sales &n
The monthly sales for Telco Batteries Inc., were as follows: Month Sales 20 21 15 14 13 16 17 18 20 20 21 23 Compute a five and a seven-month moving average for months 8 thru 12 Using the data from problem 2: Determine which of these forecasts are more accurate using the MAD. How would you explain MAD to your supervisor?
The monthly sales for Yazici Batteries, Inc., were as follows:
The monthly sales for Yazici Batteries, Inc., were as follows:MonthJanFebMarAprMayJunJulAugSeptOctNovDecSales202115121518151922212124This exercise contains only parts b and c. b) The forecast for the next month (Jan) using the naive method = _______ sales (round your response to a whole number) The forecast for the next period (Jan) using a 3-month moving average approach = _______ sales (round your response to two decimal places) The forecast for the next period (Jan) using a 6-month weighted average with weights of 0.10, 0.10, 0.10, 0.20,0.20, and 0.30,...
The monthly sales for Yazici Batteries, Inc., were as follows:
The monthly sales for Yazici Batteries, Inc., were as follows: Month Jan Feb Mar Apr May Jun Jul Aug Sept Oct Nov DecSales 19 21 17 14 11 18 16 19 20 20 23 23b) The forecast for the next month (Jan) using the naive method (round your response to a whole number)The forecast for the next period (Jan) using a 3-month moving average approach =(round your response to two decimal places)The forecast for the next period (Jan) using a 6-month weighted average with weights ofandwhere the heaviest weights are applied to the most recent month = (round your response to one decimalplace)Using...
Question 1: The monthly sales for Telco Batteries, Inc. in a given year were as follows:...
 Question 1: The monthly sales for Telco Batteries, Inc. in a given year were as follows: Month Jan Feb Mar Apr May June July Aug Sep Oct Demand 46 47 50 49 50 48 51 49 52 53 Nov. Dec. 52 54 C. Forecast next year January sales using the following methods: I. Linear regression (You can use excel to get slope and intercept) ii. Trend adjusted exponential smoothing model. Use a = 0.2, B = 0.3, for the month...
The monthly sales for Yazici Batteries, Inc. were as follows: Month Jan 20 Feb 21 Mar...
 The monthly sales for Yazici Batteries, Inc. were as follows: Month Jan 20 Feb 21 Mar 16 Apr May 15 13 Jun 18 Jul 15 Aug Sept Oct Nov Dec 18 19 22 202 This exercise contains only parts de b) The forecast for the next month (Jan) using the naive method = 24 sales (round your response to a whole number) The forecast for the next period (Jan) using a 3-month moving average approach = 22 sales (round your...
The monthly sales for Yazici Batteries, Inc., were as follows: Jan Month Feb Mar Apr May...
 The monthly sales for Yazici Batteries, Inc., were as follows: Jan Month Feb Mar Apr May Jun Jul Aug Sept Oct Nov Dec 24 Sales 19 23 16 15 13 15 17 18 22 21 23 This exercise contains only parts b and c. b) The forecast for the next month (Jan) using the naive method 24 sales (round your response to a whole number) The forecast for the next period (Jan) using a 3-month moving average approach 22.67sales (round...
The monthly sales for Yazici Batteries, Inc., were as follows: Month Sept Oct Nov Dec Sales...
The monthly sales for Yazici Batteries, Inc., were as follows: Month Sept Oct Nov Dec Sales 20 21 23 24 a) Compute the January sales forecast using a trend projection. Using a method of trend projection, the forecast for January Sales is __________. (Round your response to two decimal places.) b) The regression equation is _______________. The average Sales increase per month is __________. c) Using a method of trend projection, the forecast for April is _______. (Round your...
The monthly sales for Yazici batteries were as follows on January 21, February 20, March 16,...
The monthly sales for Yazici batteries were as follows on January 21, February 20, March 16, April 15.May 15,June 18,July 17,August 18, September 22, October 20, November 21, December 24. forcast for the next month (Jan) using the naive method. The forecast for the next period (Jan) using the 3-month moving approach. Using smoothing with a=0.30 and a September forecast of 18.00 the forecast for the next period (Jan) sales.
A can opener manufacturer has had monthly sales for a seven-month period as follows: Month ...
A can opener manufacturer has had monthly sales for a seven-month period as follows: Month Sales (000 units) Feb. 19 Mar. 18 Apr. 15 May 20 Jun. 18 Jul. 22 Aug. 20 a) Plot the data b) Forecast September's sales volume and the previous months and calculate MAD for each method using each of the following: 1)The naïve approach. 2)A four-month moving average. 3)A weighted average using .50 for the recent month, .30 for 2 months ago, and .20...
Actual sales of TV's for the first six month in 2021 were as follows: January 60 ...
Actual sales of TV's for the first six month in 2021 were as follows: January 60 February 80 March 42 April 68 May 44 June 72 Use this information and determine in whole numbers: 1 The average actual monthly sales for that period 2 Trends: Reduce this average by 6% per month for the next three months 3 Simple Moving Average (SMA): make a forecast for July using a three months simple moving average. 4 Weighted Moving Average (WMA): make...
 Question 1: The monthly sales for Telco Batteries, Inc. in a given year were as follows: Month Jan Feb Mar Apr May June July Aug Sep Oct Demand 46 47 50 49 50 48 51 49 52 53 Nov. Dec. 52 54 C. Forecast next year January sales using the following methods: I. Linear regression (You can use excel to get slope and intercept) ii. Trend adjusted exponential smoothing model. Use a = 0.2, B = 0.3, for the month...
 The monthly sales for Yazici Batteries, Inc. were as follows: Month Jan 20 Feb 21 Mar 16 Apr May 15 13 Jun 18 Jul 15 Aug Sept Oct Nov Dec 18 19 22 202 This exercise contains only parts de b) The forecast for the next month (Jan) using the naive method = 24 sales (round your response to a whole number) The forecast for the next period (Jan) using a 3-month moving average approach = 22 sales (round your...
 The monthly sales for Yazici Batteries, Inc., were as follows: Jan Month Feb Mar Apr May Jun Jul Aug Sept Oct Nov Dec 24 Sales 19 23 16 15 13 15 17 18 22 21 23 This exercise contains only parts b and c. b) The forecast for the next month (Jan) using the naive method 24 sales (round your response to a whole number) The forecast for the next period (Jan) using a 3-month moving average approach 22.67sales (round...
Most questions answered within 3 hours.
-
Where is the error in this code sequence?
String s1 = "Hello";
String s2 = "ello";...
asked 11 months ago -
Financial data for Joel de Paris, Inc., for last year
follow:
Joel de Paris, Inc.
Balance...
asked 11 months ago -
Consider this reaction:
Al2(SO4)3 (aq)+ BaCl3
(aq) Al2Cl6 (aq)- +
3BaSO4(s) . What is the...
asked 11 months ago -
Suppose that Savneet is considering increasing her
recent random sample from 20 car rentals to 40...
asked 11 months ago -
Trucks arrive at an unloading terminal at an average rate of 120
per hour.
Trucks arrive...
asked 11 months ago -
Why are methanol and ethanol completely soluble in water while
octanol is not very little soluble....
asked 11 months ago -
A facilities manager at a university reads in a research report
that the mean amount of...
asked 11 months ago -
When the CuSO4 is rehydrated by adding water to the anhydrous
compound, is this an endothermic...
asked 11 months ago -
A ray of sunlight is passing from diamond into crown glass; the
angle of incidence is...
asked 11 months ago -
A block of mass 0.249 kg is placed on top of a light, vertical
spring of...
asked 11 months ago -
how do the kidneys compensate in the presences of acidosis
a) trigger hyperventilate
b) reserve acid...
asked 11 months ago -
Question 501 pts
The rental rate of capital to the firm increases. Which of the
following...
asked 11 months ago