
Homework Answers
b)
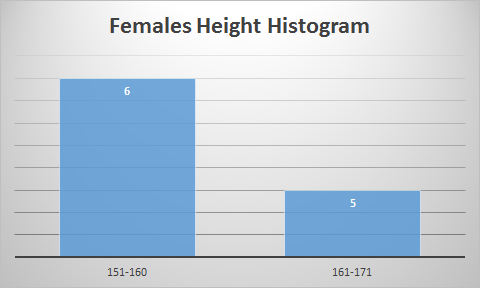
Histogram of Age for Males and Females

c)
Stem and Leaf Plots


d)
We calculate the frequencies of Both Males and Females heights and then plot the below histograms.
|
Range |
Females Freq |
|
151-160 |
6 |
|
161-171 |
5 |
|
Range |
Males Freq |
|
167-176 |
4 |
|
177-186 |
5 |

Add Answer to:
Need 3b,3c,3d
This exercise also gives you practice with the ideas of Unit 1, Sections 4...
I need help with 3b,3c,3d This exercise also gives you practice with the ideas of Unit...
 I
need help with 3b,3c,3d
This exercise also gives you practice with the ideas of Unit 1, Sections 4 ("Summaries for Qualitative Data") and 5 ("Graphical Summaries for Quantitative Data" "Data were recorded on the age in years and height in cm of 20 high school students in a classroom. Females Males Age Height Age Height 15 15 16 15 15 15 16 16 15 15 16 170 154 160 159 156 153 166 163 167 151 15 16 16...
I
need help with 3b,3c,3d
This exercise also gives you practice with the ideas of Unit 1, Sections 4 ("Summaries for Qualitative Data") and 5 ("Graphical Summaries for Quantitative Data" "Data were recorded on the age in years and height in cm of 20 high school students in a classroom. Females Males Age Height Age Height 15 15 16 15 15 15 16 16 15 15 16 170 154 160 159 156 153 166 163 167 151 15 16 16...
This exercise gives you practice with the ideas of Unit 1, Sections 4 ("Summaries for Qualitative...
 This exercise gives you practice with the ideas of Unit 1, Sections 4 ("Summaries for Qualitative Data") and 5 ("Graphical Summaries for Quantitative Data") Using the data below (source: Daniel, 6 edition page 30, problem 2.3.5), 7 10 12 4 8 7 3 8 5 12 11 381113 104 8 13 17 17 34 5 5 3 1 17 10 47 7 118 2a. By hand, construct a stem and leaf display. 2b. By hand, construct a frequency table with...
I need 3b and 3c Cicrise gives you practice putting it all together The following table...
 I need 3b and 3c
Cicrise gives you practice putting it all together The following table shows the age distribution of cases of a certain disease reported during a year in a particular state. Age Number of Cases 5-14 15-24 25-34 35-44 45-54 55-64 10 20 TOTAL 75 3a. Construct a frequency table with columns for class endpoints, class midpoint, frequency, relative frequency, cumulative frequency, and cumulative relative frequency 3b. Construct a cumulative relative frequency plot of the data. Use...
I need 3b and 3c
Cicrise gives you practice putting it all together The following table shows the age distribution of cases of a certain disease reported during a year in a particular state. Age Number of Cases 5-14 15-24 25-34 35-44 45-54 55-64 10 20 TOTAL 75 3a. Construct a frequency table with columns for class endpoints, class midpoint, frequency, relative frequency, cumulative frequency, and cumulative relative frequency 3b. Construct a cumulative relative frequency plot of the data. Use...
This is a big task. Need in 1hour 30min, ONLY NEED: 1D, 1E, 3B, 3C, 3D PART 1 - For now, you ass...
 This is a big task. Need in 1hour 30min, ONLY NEED: 1D, 1E, 3B,
3C, 3D
PART 1 - For now, you assume both of the claims about the
population are correct.
1a. Given the assumed pop. mean and st.dev, calculate the
probability of observing a value above the number for your first
data point in your file.
1b. Suppose you collected 8 new data points in a new sample.
Calculate the probability that the mean of these 8 new...
This is a big task. Need in 1hour 30min, ONLY NEED: 1D, 1E, 3B,
3C, 3D
PART 1 - For now, you assume both of the claims about the
population are correct.
1a. Given the assumed pop. mean and st.dev, calculate the
probability of observing a value above the number for your first
data point in your file.
1b. Suppose you collected 8 new data points in a new sample.
Calculate the probability that the mean of these 8 new...
 I
need help with 3b,3c,3d
This exercise also gives you practice with the ideas of Unit 1, Sections 4 ("Summaries for Qualitative Data") and 5 ("Graphical Summaries for Quantitative Data" "Data were recorded on the age in years and height in cm of 20 high school students in a classroom. Females Males Age Height Age Height 15 15 16 15 15 15 16 16 15 15 16 170 154 160 159 156 153 166 163 167 151 15 16 16...
I
need help with 3b,3c,3d
This exercise also gives you practice with the ideas of Unit 1, Sections 4 ("Summaries for Qualitative Data") and 5 ("Graphical Summaries for Quantitative Data" "Data were recorded on the age in years and height in cm of 20 high school students in a classroom. Females Males Age Height Age Height 15 15 16 15 15 15 16 16 15 15 16 170 154 160 159 156 153 166 163 167 151 15 16 16...
 This exercise gives you practice with the ideas of Unit 1, Sections 4 ("Summaries for Qualitative Data") and 5 ("Graphical Summaries for Quantitative Data") Using the data below (source: Daniel, 6 edition page 30, problem 2.3.5), 7 10 12 4 8 7 3 8 5 12 11 381113 104 8 13 17 17 34 5 5 3 1 17 10 47 7 118 2a. By hand, construct a stem and leaf display. 2b. By hand, construct a frequency table with...
 I need 3b and 3c
Cicrise gives you practice putting it all together The following table shows the age distribution of cases of a certain disease reported during a year in a particular state. Age Number of Cases 5-14 15-24 25-34 35-44 45-54 55-64 10 20 TOTAL 75 3a. Construct a frequency table with columns for class endpoints, class midpoint, frequency, relative frequency, cumulative frequency, and cumulative relative frequency 3b. Construct a cumulative relative frequency plot of the data. Use...
I need 3b and 3c
Cicrise gives you practice putting it all together The following table shows the age distribution of cases of a certain disease reported during a year in a particular state. Age Number of Cases 5-14 15-24 25-34 35-44 45-54 55-64 10 20 TOTAL 75 3a. Construct a frequency table with columns for class endpoints, class midpoint, frequency, relative frequency, cumulative frequency, and cumulative relative frequency 3b. Construct a cumulative relative frequency plot of the data. Use...
 This is a big task. Need in 1hour 30min, ONLY NEED: 1D, 1E, 3B,
3C, 3D
PART 1 - For now, you assume both of the claims about the
population are correct.
1a. Given the assumed pop. mean and st.dev, calculate the
probability of observing a value above the number for your first
data point in your file.
1b. Suppose you collected 8 new data points in a new sample.
Calculate the probability that the mean of these 8 new...
This is a big task. Need in 1hour 30min, ONLY NEED: 1D, 1E, 3B,
3C, 3D
PART 1 - For now, you assume both of the claims about the
population are correct.
1a. Given the assumed pop. mean and st.dev, calculate the
probability of observing a value above the number for your first
data point in your file.
1b. Suppose you collected 8 new data points in a new sample.
Calculate the probability that the mean of these 8 new...
Most questions answered within 3 hours.
-
Where is the error in this code sequence?
String s1 = "Hello";
String s2 = "ello";...
asked 10 months ago -
Financial data for Joel de Paris, Inc., for last year
follow:
Joel de Paris, Inc.
Balance...
asked 10 months ago -
Consider this reaction:
Al2(SO4)3 (aq)+ BaCl3
(aq) Al2Cl6 (aq)- +
3BaSO4(s) . What is the...
asked 10 months ago -
Suppose that Savneet is considering increasing her
recent random sample from 20 car rentals to 40...
asked 10 months ago -
Trucks arrive at an unloading terminal at an average rate of 120
per hour.
Trucks arrive...
asked 10 months ago -
Why are methanol and ethanol completely soluble in water while
octanol is not very little soluble....
asked 10 months ago -
A facilities manager at a university reads in a research report
that the mean amount of...
asked 10 months ago -
When the CuSO4 is rehydrated by adding water to the anhydrous
compound, is this an endothermic...
asked 10 months ago -
A ray of sunlight is passing from diamond into crown glass; the
angle of incidence is...
asked 10 months ago -
A block of mass 0.249 kg is placed on top of a light, vertical
spring of...
asked 10 months ago -
how do the kidneys compensate in the presences of acidosis
a) trigger hyperventilate
b) reserve acid...
asked 10 months ago -
Question 501 pts
The rental rate of capital to the firm increases. Which of the
following...
asked 10 months ago