
Homework Answers
If a particle starts from position with initial velocity
, and
acceleration
(constant).
Position of particle as a function of time is
During the position time plot(quadratic fit), equation used is
Comparing the two equations,
Hence A is equal to half of the acceleration.
---------------
When a particle moves with initial velocity , and acceleration
Velocity of a particle as a function of time is
For the linear fit of velocity Vs time, the equation used is
comparing the above two equations, ,
That is slope of best fit line is equal to
acceleration (
).
-----------------
Acceleration from quadratic fit is
Acceleration from best fit line is
Percentage difference in accelerations is
----------------
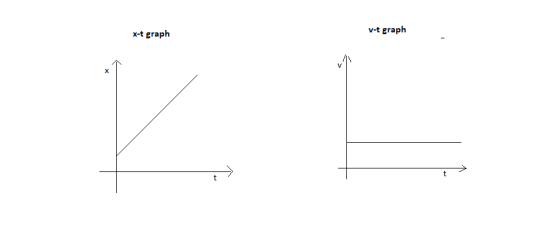
If the cart did not accelerate, velocity will be constant.( acceleration is zero)
,
Add Answer to:
need help please
DO A QUADRATIC FIT ON THE POSITION VS, TIME GRAPH, THE VALUE OF...
Please note that X is time Value Position vs Time Linear Fit m y = mx...
 Please note that X is
time
Value Position vs Time Linear Fit m y = mx + b Quadratic Fit Α. B 0.305 -0.0583 y=0.305x -0.0583 4 1 0.110 -0.0663 0.195... yöllx'-0.0663x7.195 |(1.550, 0.359) 1(1.600,0.373) 0.28 y = Ax?+ Bx + C (x1, yı) (x2, Y2) Slope For Position vs Time data: (a) Did your quadratic fit of this graph provide initial position? If yes, what is its value? (4 points) (b) Did your quadratic fit of this graph provide...
Please note that X is
time
Value Position vs Time Linear Fit m y = mx + b Quadratic Fit Α. B 0.305 -0.0583 y=0.305x -0.0583 4 1 0.110 -0.0663 0.195... yöllx'-0.0663x7.195 |(1.550, 0.359) 1(1.600,0.373) 0.28 y = Ax?+ Bx + C (x1, yı) (x2, Y2) Slope For Position vs Time data: (a) Did your quadratic fit of this graph provide initial position? If yes, what is its value? (4 points) (b) Did your quadratic fit of this graph provide...
1) a) For the position vs. time graph shown below, sketch the velocity vs. time and...
 1) a) For the position vs. time graph shown below, sketch the velocity vs. time and acceleration vs. time graphs corresponding to the motion. (5 pts each) Beside the position and acceleration graphs, describe the motion of the object and explain why you drew the graph the way you did. (10 pts) 25 pts total
The slope A of your best fit line on the force vs acceleration graph should be...
 The slope A of your best fit line on the force vs acceleration
graph should be equal to the mass of the cart and probe (in kg), if
force and acceleration truly are proportional. How does the slope
value compare with the mass value?
The slope A of your best fit line on the force vs acceleration
graph should be equal to the mass of the cart and probe (in kg), if
force and acceleration truly are proportional. How does the slope
value compare with the mass value?
Please answer physics lab questions SECTION: DATE: ANALYSIS PARTI: POSITION VS. TIME GRAPH MATCHING I. Describe...
 Please answer physics lab questions
SECTION: DATE: ANALYSIS PARTI: POSITION VS. TIME GRAPH MATCHING I. Describe how you walked for each of the graphs that you matched. When the aph hada honit. period wedid net mare wiun the crapん1ad a linlan perod we moved but at o constan sperd Explain the significance of the slope of a position vs. time graph. Include a discussion of positive 2. and negative slope. 3. What type of motion is occurring when the slope...
Please answer physics lab questions
SECTION: DATE: ANALYSIS PARTI: POSITION VS. TIME GRAPH MATCHING I. Describe how you walked for each of the graphs that you matched. When the aph hada honit. period wedid net mare wiun the crapん1ad a linlan perod we moved but at o constan sperd Explain the significance of the slope of a position vs. time graph. Include a discussion of positive 2. and negative slope. 3. What type of motion is occurring when the slope...
Please explain For each of the velocity vs. time graphs below, sketch possible comesponding position vs....
 Please explain
For each of the velocity vs. time graphs below, sketch possible comesponding position vs. time and acceleration vs. time graphs. To the right of the graph, briefly describe the motion of the object and why the graphs you drew are consistent with the velocity graph. Where is the object at time t 0 in each case? Explain
Please explain
For each of the velocity vs. time graphs below, sketch possible comesponding position vs. time and acceleration vs. time graphs. To the right of the graph, briefly describe the motion of the object and why the graphs you drew are consistent with the velocity graph. Where is the object at time t 0 in each case? Explain
For each of the velocity vs. time graphs below, sketch possible corresponding position vs. time and...
 For each of the velocity vs. time graphs below, sketch possible
corresponding position vs. time and acceleration vs. time graphs.
To the right of the graph, briefly describe the motion of the
object and why the graphs you drew are consistent with the velocity
graph. Where is the object at time t = 0 in each case?
Explain.
For each of the velocity vs. time graphs below, sketch possible
corresponding position vs. time and acceleration vs. time graphs.
To the right of the graph, briefly describe the motion of the
object and why the graphs you drew are consistent with the velocity
graph. Where is the object at time t = 0 in each case?
Explain.
Part 2: Velocity vs. Time 1. For each velocity vs. time graph (Graph 3 and 4), describe how you w...
 Part 2: Velocity vs. Time 1. For each velocity vs. time graph (Graph 3 and 4), describe how you would walk in order to replicate the 1-D motion graph. Use words such as away, toward, at rest, speeding up, slowing down, constant speed. Be specific with your time periods. 2. For each velocity vs. time graph, create the corresponding position and acceleration versus time graphs. Construct your graph on a computer program such as Microsoft ExcelB. If you do not...
Constant Positive Accederation Recall that acceleration is the slope of the v-t graph Position vs. Time...
 Constant Positive Accederation Recall that acceleration is the slope of the v-t graph Position vs. Time Time (s1 Position ml Velocity bos) 0 0.2 2.5 0.4 1.5 0.5 0.6 Velocity vs. Time 0.8 1.2 2.5 1.4 0.5 Timet s 1 1.6 Acceleration vs. Time 1.8 0.5 1.5 s utat V ut at Timet S i 5 15
Choose a function to represent the acceleration vs. time graph. How can you calculate the values...
Choose a function to represent the acceleration vs. time graph. How can you calculate the values of the constants of this function from the function representing the position versus time graph? Check how well this works. You can also estimate the values of the constants from the graph. What kinematics quantities do these constants represent? Record the corresponding kinematic quantities and the values of the corresponding errors. From either the position vs. time, velocity vs. time, or acceleration vs. time...
Please help with this Kinematics question! Position and time graphs. Velocity vs. time graph. Consider this...
 Please help with this Kinematics question! Position and time
graphs. Velocity vs. time graph.
Consider this position vs. does the corresponding velocity vs. time graph look like? 1. time graph. What (a) Sketch your prediction below * Now reproduce the position graph by walking, and see if the velocity graph comes out the way you expect. 10 t (seconds) Velocity Graph Prediction Velocity Graph Result (m/s) o (m/s) 0 10 6 10 t (seconds) t (seconds) 2. Here's a velocity...
Please help with this Kinematics question! Position and time
graphs. Velocity vs. time graph.
Consider this position vs. does the corresponding velocity vs. time graph look like? 1. time graph. What (a) Sketch your prediction below * Now reproduce the position graph by walking, and see if the velocity graph comes out the way you expect. 10 t (seconds) Velocity Graph Prediction Velocity Graph Result (m/s) o (m/s) 0 10 6 10 t (seconds) t (seconds) 2. Here's a velocity...
 Please note that X is
time
Value Position vs Time Linear Fit m y = mx + b Quadratic Fit Α. B 0.305 -0.0583 y=0.305x -0.0583 4 1 0.110 -0.0663 0.195... yöllx'-0.0663x7.195 |(1.550, 0.359) 1(1.600,0.373) 0.28 y = Ax?+ Bx + C (x1, yı) (x2, Y2) Slope For Position vs Time data: (a) Did your quadratic fit of this graph provide initial position? If yes, what is its value? (4 points) (b) Did your quadratic fit of this graph provide...
Please note that X is
time
Value Position vs Time Linear Fit m y = mx + b Quadratic Fit Α. B 0.305 -0.0583 y=0.305x -0.0583 4 1 0.110 -0.0663 0.195... yöllx'-0.0663x7.195 |(1.550, 0.359) 1(1.600,0.373) 0.28 y = Ax?+ Bx + C (x1, yı) (x2, Y2) Slope For Position vs Time data: (a) Did your quadratic fit of this graph provide initial position? If yes, what is its value? (4 points) (b) Did your quadratic fit of this graph provide...
 1) a) For the position vs. time graph shown below, sketch the velocity vs. time and acceleration vs. time graphs corresponding to the motion. (5 pts each) Beside the position and acceleration graphs, describe the motion of the object and explain why you drew the graph the way you did. (10 pts) 25 pts total
 The slope A of your best fit line on the force vs acceleration
graph should be equal to the mass of the cart and probe (in kg), if
force and acceleration truly are proportional. How does the slope
value compare with the mass value?
The slope A of your best fit line on the force vs acceleration
graph should be equal to the mass of the cart and probe (in kg), if
force and acceleration truly are proportional. How does the slope
value compare with the mass value?
 Please answer physics lab questions
SECTION: DATE: ANALYSIS PARTI: POSITION VS. TIME GRAPH MATCHING I. Describe how you walked for each of the graphs that you matched. When the aph hada honit. period wedid net mare wiun the crapん1ad a linlan perod we moved but at o constan sperd Explain the significance of the slope of a position vs. time graph. Include a discussion of positive 2. and negative slope. 3. What type of motion is occurring when the slope...
Please answer physics lab questions
SECTION: DATE: ANALYSIS PARTI: POSITION VS. TIME GRAPH MATCHING I. Describe how you walked for each of the graphs that you matched. When the aph hada honit. period wedid net mare wiun the crapん1ad a linlan perod we moved but at o constan sperd Explain the significance of the slope of a position vs. time graph. Include a discussion of positive 2. and negative slope. 3. What type of motion is occurring when the slope...
 Please explain
For each of the velocity vs. time graphs below, sketch possible comesponding position vs. time and acceleration vs. time graphs. To the right of the graph, briefly describe the motion of the object and why the graphs you drew are consistent with the velocity graph. Where is the object at time t 0 in each case? Explain
Please explain
For each of the velocity vs. time graphs below, sketch possible comesponding position vs. time and acceleration vs. time graphs. To the right of the graph, briefly describe the motion of the object and why the graphs you drew are consistent with the velocity graph. Where is the object at time t 0 in each case? Explain
 For each of the velocity vs. time graphs below, sketch possible
corresponding position vs. time and acceleration vs. time graphs.
To the right of the graph, briefly describe the motion of the
object and why the graphs you drew are consistent with the velocity
graph. Where is the object at time t = 0 in each case?
Explain.
For each of the velocity vs. time graphs below, sketch possible
corresponding position vs. time and acceleration vs. time graphs.
To the right of the graph, briefly describe the motion of the
object and why the graphs you drew are consistent with the velocity
graph. Where is the object at time t = 0 in each case?
Explain.
 Part 2: Velocity vs. Time 1. For each velocity vs. time graph (Graph 3 and 4), describe how you would walk in order to replicate the 1-D motion graph. Use words such as away, toward, at rest, speeding up, slowing down, constant speed. Be specific with your time periods. 2. For each velocity vs. time graph, create the corresponding position and acceleration versus time graphs. Construct your graph on a computer program such as Microsoft ExcelB. If you do not...
 Constant Positive Accederation Recall that acceleration is the slope of the v-t graph Position vs. Time Time (s1 Position ml Velocity bos) 0 0.2 2.5 0.4 1.5 0.5 0.6 Velocity vs. Time 0.8 1.2 2.5 1.4 0.5 Timet s 1 1.6 Acceleration vs. Time 1.8 0.5 1.5 s utat V ut at Timet S i 5 15
 Please help with this Kinematics question! Position and time
graphs. Velocity vs. time graph.
Consider this position vs. does the corresponding velocity vs. time graph look like? 1. time graph. What (a) Sketch your prediction below * Now reproduce the position graph by walking, and see if the velocity graph comes out the way you expect. 10 t (seconds) Velocity Graph Prediction Velocity Graph Result (m/s) o (m/s) 0 10 6 10 t (seconds) t (seconds) 2. Here's a velocity...
Please help with this Kinematics question! Position and time
graphs. Velocity vs. time graph.
Consider this position vs. does the corresponding velocity vs. time graph look like? 1. time graph. What (a) Sketch your prediction below * Now reproduce the position graph by walking, and see if the velocity graph comes out the way you expect. 10 t (seconds) Velocity Graph Prediction Velocity Graph Result (m/s) o (m/s) 0 10 6 10 t (seconds) t (seconds) 2. Here's a velocity...
Most questions answered within 3 hours.
-
Where is the error in this code sequence?
String s1 = "Hello";
String s2 = "ello";...
asked 11 months ago -
Financial data for Joel de Paris, Inc., for last year
follow:
Joel de Paris, Inc.
Balance...
asked 11 months ago -
Consider this reaction:
Al2(SO4)3 (aq)+ BaCl3
(aq) Al2Cl6 (aq)- +
3BaSO4(s) . What is the...
asked 11 months ago -
Suppose that Savneet is considering increasing her
recent random sample from 20 car rentals to 40...
asked 11 months ago -
Trucks arrive at an unloading terminal at an average rate of 120
per hour.
Trucks arrive...
asked 11 months ago -
Why are methanol and ethanol completely soluble in water while
octanol is not very little soluble....
asked 11 months ago -
A facilities manager at a university reads in a research report
that the mean amount of...
asked 11 months ago -
When the CuSO4 is rehydrated by adding water to the anhydrous
compound, is this an endothermic...
asked 11 months ago -
A ray of sunlight is passing from diamond into crown glass; the
angle of incidence is...
asked 11 months ago -
A block of mass 0.249 kg is placed on top of a light, vertical
spring of...
asked 11 months ago -
how do the kidneys compensate in the presences of acidosis
a) trigger hyperventilate
b) reserve acid...
asked 11 months ago -
Question 501 pts
The rental rate of capital to the firm increases. Which of the
following...
asked 11 months ago