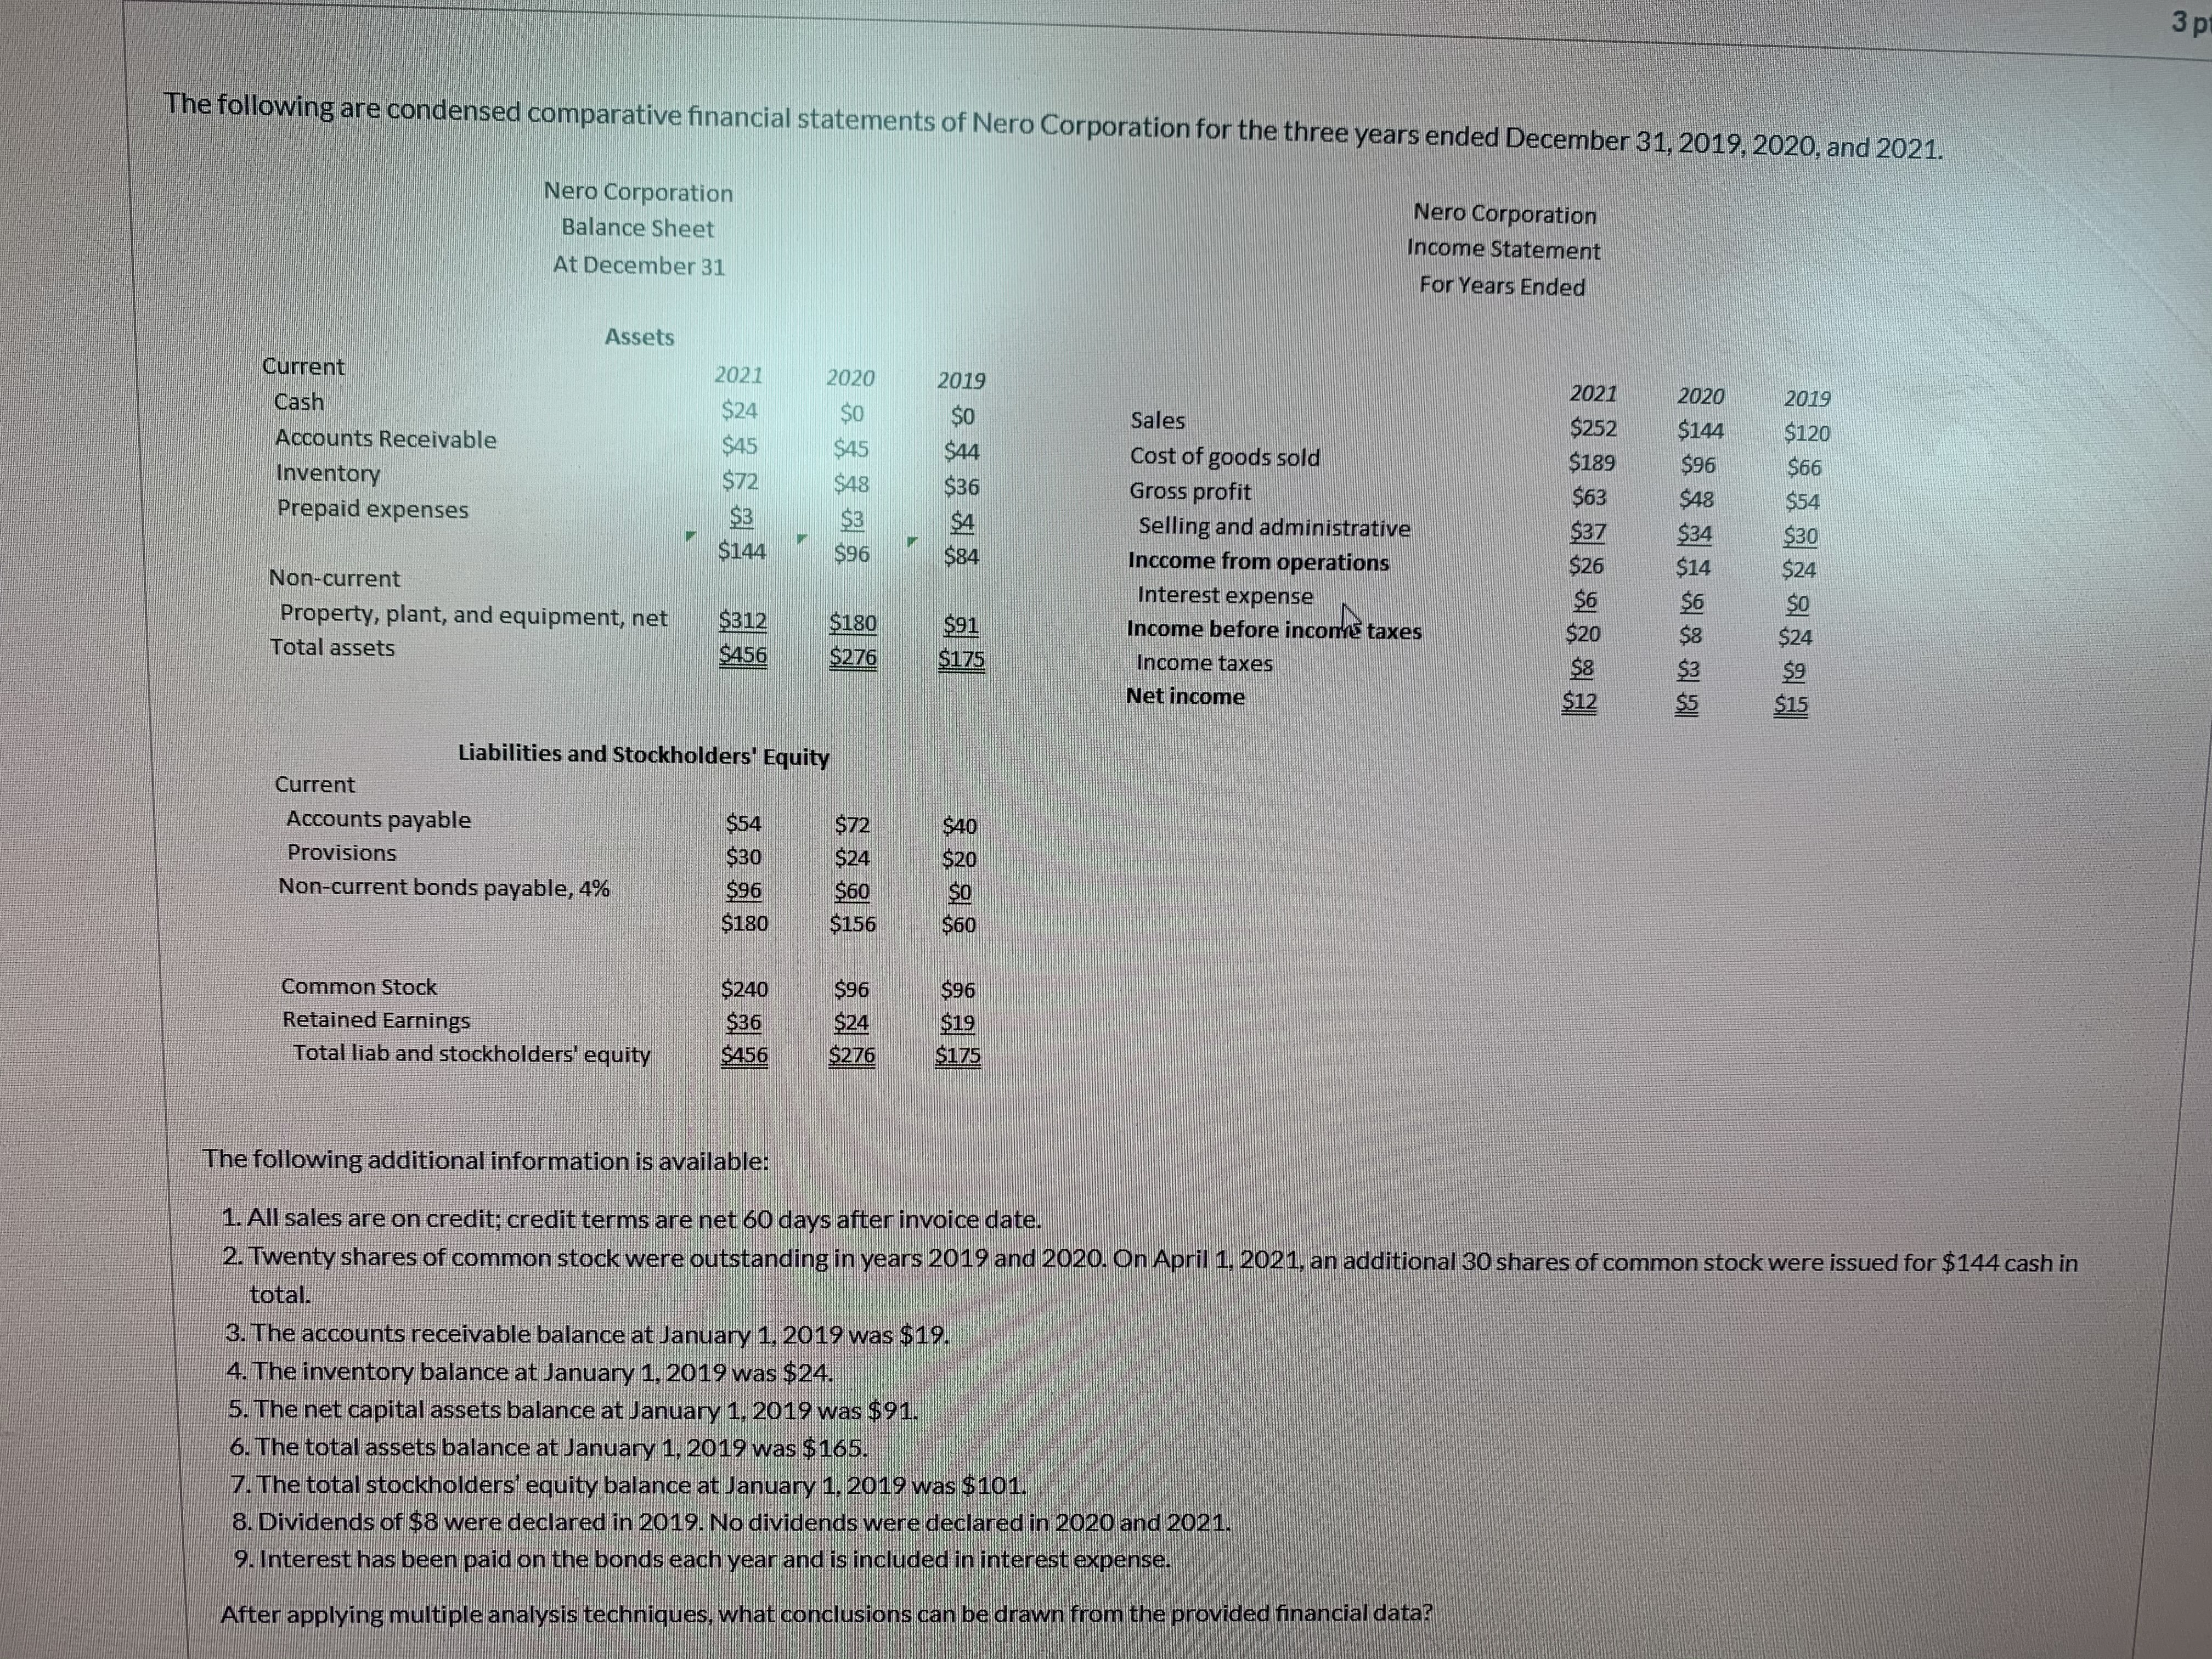
The following are condensed comparative financial statements of Nero Corporation for the three yers ended December 31, 2019, 2020, and 2021.
Homework Answers
Conclusions which can be drawn are:
- Owing to more than 100% growth in sales and same levels of accounts receivable in 2021 as compared to 2019 and 2020 the company has recovered from being cash deficient to cash surplus.
- Same levels of accounts receivables in spite of the huge increase in sales shows that the company has improved their collection exercises. The reasons for the same can also be the cash discount on early payment
- Inventory increased in correspondence with the sales level
- PPE also increased significantly to support the extra sales
- Gross profit has decreased continuosly. In 2019 it was more than 50% which fell to 25% in 2021
- Although selling expenses has decreased as a percentage of sales increase in 2021
Add Answer to:
The following are condensed comparative financial statements of Nero Corporation for the three yers ended December 31, 2019, 2020, and 2021.
LOGIC COMPANY Comparative Income Statement For Years Ended December 31, 2019 and 2020 2019 2020 Gross...
 LOGIC COMPANY Comparative Income Statement For Years Ended December 31, 2019 and 2020 2019 2020 Gross sales $19,000 1,000 $18,000 12,000 $6,000 $15,000 100 Sales returns and allowances Net sales Cost of merchandise (goods) sold Gross profit Operating expenses: Depreciation Selling and administrative Research $14,900 9,000 $5,900 $ $ 2,000 500 600 700 2,200 550 Miscellaneous Total operating expenses Income before interest and taxes Interest expense Income before taxes Provision for taxes 360 300 $3,810 $ 2,190 $3,400 2,500 560...
LOGIC COMPANY Comparative Income Statement For Years Ended December 31, 2019 and 2020 2020 2019 Gross...
 LOGIC COMPANY Comparative Income Statement For Years Ended December 31, 2019 and 2020 2020 2019 Gross sales $15,000 $19,000 1,000 $18,000 12,000 $ 6,000 Sales returns and allowances 100 $14,900 9,000 Net sales Cost of merchandise (goods) sold Gross profit Operating expenses: Depreciation Selling and administrative $ 5,900 $ 2,200 550 360 700 600 2,000 Research Miscellaneous Total operating expenses Income before interest and taxes Interest expense Income before taxes Provision for taxes 500 300 $ 3,400 $ 2,500 $3,810...
The condensed financial statements for OIL Inc. and ERS Company for the year ended December 31,...
The condensed financial statements for OIL Inc. and ERS Company for the year ended December 31, Year 5, follow: OIL ERS Revenues $ 945,000 $ 330,000 Expenses 675,000 215,000 Net income $ 270,000 $ 115,000 Retained earnings, 1/1/Year 5 $ 815,000 $ 215,000 Net income 270,000 115,000 Dividends paid 105,000 0 Retained earnings, 12/31/Year 5 $ 980,000 $ 330,000 Cash $ 95,000 $ 125,000 Receivables and inventory 415,000 185,000 Patented technology (net) 915,000 322,500 Equipment (net) 715,000 615,000 Total assets...
Excerpts from Stealth Company's December 31, 2021 and 2020, financial statements are presented below: 2021 2020...
 Excerpts from Stealth Company's December 31, 2021 and 2020, financial statements are presented below: 2021 2020 $ 36,000 $ 40,000 Accounts receivable 28,000 35,000 Inventory Net sales 190,000 114,000 425,000 240,000 32,500 186,000 108,000 Cost of goods sold Total assets 405,000 225,000 28,000 Total stockholders' equity Net income Stealth Company's 2021 profit margin is: (Round your answer to 1 decimal place.) Multiple Cholce 17.1%. 13.5%. 7.6%. 4.5%.
Excerpts from Hulkster Company's December 31, 2021 and 2020, financial statements are presented below: 2021 2020...
Excerpts from Hulkster Company's December 31, 2021 and 2020, financial statements are presented below: 2021 2020 Accounts receivable $ 40,000 $ 36,000 Merchandise inventory $ 28,000 35,000 Net sales 190,000 186,000 Cost of goods sold 114,000 108,000 Total assets 425,000 405,000 Total shareholders' equity 240,000 225,000 Net income 32,500 28,000 Hulkster's 2021 receivables turnover is: Multiple Choice 2.85. 4.70. 5.00. 10.63.
Wildhorse Corporation reports the following amounts in its 2020 financial statements: At December 31, 2020 For...
 Wildhorse Corporation reports the following amounts in its 2020 financial statements: At December 31, 2020 For the Year 2020 $1,100,000 550,000 Total assets Total liabilities Total stockholders' equity Interest expense Income tax expense Net income $ 20,000 136,500 157,500 Compute the December 31, 2020, balance in stockholders' equity. Total stockholders' equitys Compute the debt to assets ratio at December 31, 2020. Debt to assets ratio Compute times interest earned for 2020. (Round answer to 2 decimal places, e.g. 15.25.) Times...
Financial statement analysis The financial statements of Zach Industries for the year ended December 31, 2019,...
 Financial statement analysis The financial statements of Zach Industries for the year ended December 31, 2019, follow. P3-24 Zach Industries Income Statement for the Year Ended December 31, 2019 Sales revenue $160,000 Less: Cost of goods sold Gross profits Less: Operating expenses Selling expense General and administrative expenses 106,000 $ 54,000 $ 16,000 10,000 Lease expense 1,000 Depreciation expense Total operating expense Operating profits Less: Interest expense 10,000 $ 37,000 $ 17,000 6,100 Net profits before taxes $ 10,900 Less:...
Comparative Income Statements For Years Ended December 31, 2019, 2018, and 2017 2019 2018 2017 Sales...
 Comparative Income Statements For Years Ended December 31, 2019, 2018, and 2017 2019 2018 2017 Sales $555,000 $340,000 $278,000 Cost of goods gold 283,500 212,500 153, 900 Gross profit 271, 500 127,500 124,100 Selling expenses 102,900 46,920 50,800 Administrative expenses 50, 668 29, 920 22, 800 Total expenses 153,568 76,840 73,600 Income before taxes 117, 93250, 660 50, 500 Income tax expense 40,800 10,370 15,670 Net income $ 77,132 $ 40,290 $ 34,830 2017 KORBIN COMPANY Comparative Balance Sheets December...
Selected comparative financial statements of Apple-Space follow: Apple-Space Comparative Income Statements For Years Ended December 31,...
 Selected comparative financial statements of Apple-Space
follow:
Apple-Space
Comparative Income Statements
For Years Ended December 31, 2017, 2016, and
2015
2017
2016
2015
Sales
$
464,983
$
356,215
$
247,200
Cost of goods sold
279,920
225,840
158,208
Gross profit
185,063
130,375
88,992
Selling expenses
66,028
49,158
32,630
Administrative expenses
41,848
31,347
20,518
Total expenses
107,876
80,505
53,148
Income before taxes
77,187
49,870
35,844
Income taxes
14,357
10,223
7,276
Net income
$
62,830
$
39,647
$
28,568
Apple-Space
Comparative Balance Sheets...
Selected comparative financial statements of Apple-Space
follow:
Apple-Space
Comparative Income Statements
For Years Ended December 31, 2017, 2016, and
2015
2017
2016
2015
Sales
$
464,983
$
356,215
$
247,200
Cost of goods sold
279,920
225,840
158,208
Gross profit
185,063
130,375
88,992
Selling expenses
66,028
49,158
32,630
Administrative expenses
41,848
31,347
20,518
Total expenses
107,876
80,505
53,148
Income before taxes
77,187
49,870
35,844
Income taxes
14,357
10,223
7,276
Net income
$
62,830
$
39,647
$
28,568
Apple-Space
Comparative Balance Sheets...
Selected information from the comparative financial statements of Francona Company for the years ended December 31,...
Selected information from the comparative financial statements of Francona Company for the years ended December 31, 2016 and December 31, 2017 appear below: 2017 2016 Cash $370,000 $135,000 Accounts receivable (net) 175,000 200,000 Inventory 130,000 170,000 Property, plant and equipment 425,000 295,000 Total assets 1,100,000 800,000 Current liabilities 140,000 110,000 Long-term debt 410,000 300,000 Owner’s equity 550,000 390,000 Total liabilities and owner’s equity 1,100,000 800,000 Net sales 900,000 700,000 Cost of goods sold 600,000 530,000 Interest expense 40,000 25,000 Income tax expense 60,000 29,000 Net income 120,000 85,000 Net cash provided by operating activities 220,000 135,000 Answer the following questions relating the Francona Company to the year ended December 31, 2017....
 LOGIC COMPANY Comparative Income Statement For Years Ended December 31, 2019 and 2020 2019 2020 Gross sales $19,000 1,000 $18,000 12,000 $6,000 $15,000 100 Sales returns and allowances Net sales Cost of merchandise (goods) sold Gross profit Operating expenses: Depreciation Selling and administrative Research $14,900 9,000 $5,900 $ $ 2,000 500 600 700 2,200 550 Miscellaneous Total operating expenses Income before interest and taxes Interest expense Income before taxes Provision for taxes 360 300 $3,810 $ 2,190 $3,400 2,500 560...
 LOGIC COMPANY Comparative Income Statement For Years Ended December 31, 2019 and 2020 2020 2019 Gross sales $15,000 $19,000 1,000 $18,000 12,000 $ 6,000 Sales returns and allowances 100 $14,900 9,000 Net sales Cost of merchandise (goods) sold Gross profit Operating expenses: Depreciation Selling and administrative $ 5,900 $ 2,200 550 360 700 600 2,000 Research Miscellaneous Total operating expenses Income before interest and taxes Interest expense Income before taxes Provision for taxes 500 300 $ 3,400 $ 2,500 $3,810...
 Excerpts from Stealth Company's December 31, 2021 and 2020, financial statements are presented below: 2021 2020 $ 36,000 $ 40,000 Accounts receivable 28,000 35,000 Inventory Net sales 190,000 114,000 425,000 240,000 32,500 186,000 108,000 Cost of goods sold Total assets 405,000 225,000 28,000 Total stockholders' equity Net income Stealth Company's 2021 profit margin is: (Round your answer to 1 decimal place.) Multiple Cholce 17.1%. 13.5%. 7.6%. 4.5%.
 Wildhorse Corporation reports the following amounts in its 2020 financial statements: At December 31, 2020 For the Year 2020 $1,100,000 550,000 Total assets Total liabilities Total stockholders' equity Interest expense Income tax expense Net income $ 20,000 136,500 157,500 Compute the December 31, 2020, balance in stockholders' equity. Total stockholders' equitys Compute the debt to assets ratio at December 31, 2020. Debt to assets ratio Compute times interest earned for 2020. (Round answer to 2 decimal places, e.g. 15.25.) Times...
 Financial statement analysis The financial statements of Zach Industries for the year ended December 31, 2019, follow. P3-24 Zach Industries Income Statement for the Year Ended December 31, 2019 Sales revenue $160,000 Less: Cost of goods sold Gross profits Less: Operating expenses Selling expense General and administrative expenses 106,000 $ 54,000 $ 16,000 10,000 Lease expense 1,000 Depreciation expense Total operating expense Operating profits Less: Interest expense 10,000 $ 37,000 $ 17,000 6,100 Net profits before taxes $ 10,900 Less:...
 Comparative Income Statements For Years Ended December 31, 2019, 2018, and 2017 2019 2018 2017 Sales $555,000 $340,000 $278,000 Cost of goods gold 283,500 212,500 153, 900 Gross profit 271, 500 127,500 124,100 Selling expenses 102,900 46,920 50,800 Administrative expenses 50, 668 29, 920 22, 800 Total expenses 153,568 76,840 73,600 Income before taxes 117, 93250, 660 50, 500 Income tax expense 40,800 10,370 15,670 Net income $ 77,132 $ 40,290 $ 34,830 2017 KORBIN COMPANY Comparative Balance Sheets December...
 Selected comparative financial statements of Apple-Space
follow:
Apple-Space
Comparative Income Statements
For Years Ended December 31, 2017, 2016, and
2015
2017
2016
2015
Sales
$
464,983
$
356,215
$
247,200
Cost of goods sold
279,920
225,840
158,208
Gross profit
185,063
130,375
88,992
Selling expenses
66,028
49,158
32,630
Administrative expenses
41,848
31,347
20,518
Total expenses
107,876
80,505
53,148
Income before taxes
77,187
49,870
35,844
Income taxes
14,357
10,223
7,276
Net income
$
62,830
$
39,647
$
28,568
Apple-Space
Comparative Balance Sheets...
Selected comparative financial statements of Apple-Space
follow:
Apple-Space
Comparative Income Statements
For Years Ended December 31, 2017, 2016, and
2015
2017
2016
2015
Sales
$
464,983
$
356,215
$
247,200
Cost of goods sold
279,920
225,840
158,208
Gross profit
185,063
130,375
88,992
Selling expenses
66,028
49,158
32,630
Administrative expenses
41,848
31,347
20,518
Total expenses
107,876
80,505
53,148
Income before taxes
77,187
49,870
35,844
Income taxes
14,357
10,223
7,276
Net income
$
62,830
$
39,647
$
28,568
Apple-Space
Comparative Balance Sheets...
Most questions answered within 3 hours.
-
Where is the error in this code sequence?
String s1 = "Hello";
String s2 = "ello";...
asked 10 months ago -
Financial data for Joel de Paris, Inc., for last year
follow:
Joel de Paris, Inc.
Balance...
asked 10 months ago -
Consider this reaction:
Al2(SO4)3 (aq)+ BaCl3
(aq) Al2Cl6 (aq)- +
3BaSO4(s) . What is the...
asked 10 months ago -
Suppose that Savneet is considering increasing her
recent random sample from 20 car rentals to 40...
asked 10 months ago -
Trucks arrive at an unloading terminal at an average rate of 120
per hour.
Trucks arrive...
asked 10 months ago -
Why are methanol and ethanol completely soluble in water while
octanol is not very little soluble....
asked 10 months ago -
A facilities manager at a university reads in a research report
that the mean amount of...
asked 10 months ago -
When the CuSO4 is rehydrated by adding water to the anhydrous
compound, is this an endothermic...
asked 10 months ago -
A ray of sunlight is passing from diamond into crown glass; the
angle of incidence is...
asked 10 months ago -
A block of mass 0.249 kg is placed on top of a light, vertical
spring of...
asked 10 months ago -
how do the kidneys compensate in the presences of acidosis
a) trigger hyperventilate
b) reserve acid...
asked 10 months ago -
Question 501 pts
The rental rate of capital to the firm increases. Which of the
following...
asked 10 months ago