
Homework Answers
Add Answer to:
5) Construct a 90% confidence interval for the population mean, p. Assume the population has a...
Construct a 90% confidence interval for the population mean, μ. Assume the population has a normal...
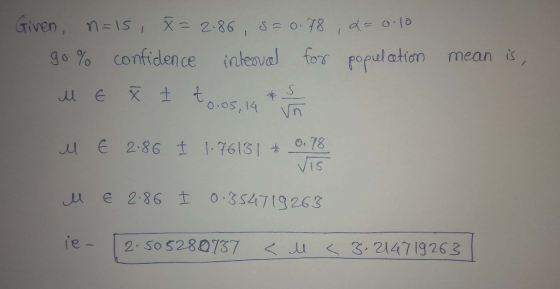
Construct a 90% confidence interval for the population mean, μ. Assume the population has a normal distribution and interpret. A sample of 15 randomly selected math majors has a grade point average of 2.86 with a standard deviation of 0.78. • You must show the shaded region. • Give the calculator keystrokes for how you got the critical value for the regions. • You must show the formula for the appropriate confidence interval, show the plugging in of values, then...
Assuming that the population is normally distributed, construct a 90% confidence interval for the population mean,...
 Assuming that the population is normally distributed, construct a 90% confidence interval for the population mean, based on the following sample size of n-6. 1, 2, 3, 4, 5, and 19 Change the number 19 to 6 and recalculate the confidence interval. Using these results, describe the effect of an outlier (that is, an extreme value) on the confidence interval. Find a 90% confidence interval for the population mean, using the formula or calculator. [ ] SHS (Round to two...
Use the given degree of confidence and sample data to construct a confidence interval for the...
 Use the given degree of confidence and sample data to construct a confidence interval for the population mean y Assume that the population has a normal distribution Thirty randomly selected students took the calculus final the sample mean was 90 and the standard deviation was 5.1. construct a 90% confidence interval for the mean score of all students. Round to be decimal places O A 87.44 <<92.56 OB. 87.71 <<92.29 OC 8743<<92.57 OD 8842 <<91.58
construct a 95% confidence interval for the population mean, Assume the population has a normal distribution....
construct a 95% confidence interval for the population mean, Assume the population has a normal distribution. A sample of 20 part-time workers had a mean annual earnings of $3120 with a standard deviation of $677. Round to the nearest dollar. *Please STEP out the problem clearly for me.
Use the given degree of confidence and sample data to construct a confidence interval for the...
 Use the given degree of confidence and sample data to construct a confidence interval for the population mean p. Assume that the population has a normal distribution. Thirty randomly selected students took the calculus final. If the sample mean was 76 and the standard deviation was 7.7, construct a 99% confidence interval for the mean score of all students. 72.13 < x < 79.87 73.61 < p < 78.39 O 72.54 < p < 79.46 O 72.14< p < 79.89
Use the given degree of confidence and the sample data to construct a confidence interval for...
 Use the given degree of confidence and the sample data to construct a confidence interval for the population mean u. Assuming the population has a normal distribution. The Administrator randomly selected six employees to take an aptitude test. Their scores were: 9.3 81.2 74.9 83.2 83.7 85.5 Determine the margin of error for the 90% confidence interval for the average score for all employees.
Use the given degree of confidence and sample data to construct a confidence interval for the...
 Use the given degree of confidence and sample data to construct a confidence interval for the population mean H. Assume that the population has a normal distribution. Thirty randomly selected students took the calculus final. If the sample mean was 82 and the standard deviation was 12.6, construct a 99% confidence interval for the mean score of all students. Round to two decimal places. O A. 75.68 < < 88.32 OB. 75.66<u < 88.34 OC. 78.09 < < 85.91 OD....
Use the given degree of confidence and sample data to construct a confidence interval for the...
Use the given degree of confidence and sample data to construct a confidence interval for the population mean mu. Assume that the population has a normal distribution. Thirty randomly selected students took the calculus final. If the sample mean was 75 and the standard deviation was 5.8, construct a 99% confidence interval for the mean score of all students. Round to two decimal places. A. 73.20<μ<76.80 B. 72.09<μ<77.91 C. 72.08<μ<77.92 D. 72.39<μ<77.61
Assuming that the population is normally distributed, construct a 90% confidence interval for the population mean...
 Assuming that the population is normally distributed, construct a 90% confidence interval for the population mean for each of the samples below. Explain why these two samples produce different confidence intervals even though they have the same mean and range. Sample A: 12 3 3 6 678Full data set Sample B: 1 2 3 45678 Construct a 90% confidence interval for the population mean for sample A. (Type integers or decimals rounded to two decimal places as needed.) Construct a...
A) Construct the indicated confidence interval for the population mean μ using the t-distribution. Assume the...
A) Construct the indicated confidence interval for the population mean μ using the t-distribution. Assume the population is normally distributed. c = 0.99, x equals = 12.4, s = 4.0, n =7 ( ? , ? ) (Round to one decimal place as needed.) B) The state test scores for 12 randomly selected high school seniors are shown on the right. Complete parts (a) through (c) below. Assume the population is normally distributed. 1424 1224 980 697 730 834 723...
 Assuming that the population is normally distributed, construct a 90% confidence interval for the population mean, based on the following sample size of n-6. 1, 2, 3, 4, 5, and 19 Change the number 19 to 6 and recalculate the confidence interval. Using these results, describe the effect of an outlier (that is, an extreme value) on the confidence interval. Find a 90% confidence interval for the population mean, using the formula or calculator. [ ] SHS (Round to two...
 Use the given degree of confidence and sample data to construct a confidence interval for the population mean y Assume that the population has a normal distribution Thirty randomly selected students took the calculus final the sample mean was 90 and the standard deviation was 5.1. construct a 90% confidence interval for the mean score of all students. Round to be decimal places O A 87.44 <<92.56 OB. 87.71 <<92.29 OC 8743<<92.57 OD 8842 <<91.58
 Use the given degree of confidence and sample data to construct a confidence interval for the population mean p. Assume that the population has a normal distribution. Thirty randomly selected students took the calculus final. If the sample mean was 76 and the standard deviation was 7.7, construct a 99% confidence interval for the mean score of all students. 72.13 < x < 79.87 73.61 < p < 78.39 O 72.54 < p < 79.46 O 72.14< p < 79.89
 Use the given degree of confidence and the sample data to construct a confidence interval for the population mean u. Assuming the population has a normal distribution. The Administrator randomly selected six employees to take an aptitude test. Their scores were: 9.3 81.2 74.9 83.2 83.7 85.5 Determine the margin of error for the 90% confidence interval for the average score for all employees.
 Use the given degree of confidence and sample data to construct a confidence interval for the population mean H. Assume that the population has a normal distribution. Thirty randomly selected students took the calculus final. If the sample mean was 82 and the standard deviation was 12.6, construct a 99% confidence interval for the mean score of all students. Round to two decimal places. O A. 75.68 < < 88.32 OB. 75.66<u < 88.34 OC. 78.09 < < 85.91 OD....
 Assuming that the population is normally distributed, construct a 90% confidence interval for the population mean for each of the samples below. Explain why these two samples produce different confidence intervals even though they have the same mean and range. Sample A: 12 3 3 6 678Full data set Sample B: 1 2 3 45678 Construct a 90% confidence interval for the population mean for sample A. (Type integers or decimals rounded to two decimal places as needed.) Construct a...
Most questions answered within 3 hours.
-
Where is the error in this code sequence?
String s1 = "Hello";
String s2 = "ello";...
asked 10 months ago -
Financial data for Joel de Paris, Inc., for last year
follow:
Joel de Paris, Inc.
Balance...
asked 10 months ago -
Consider this reaction:
Al2(SO4)3 (aq)+ BaCl3
(aq) Al2Cl6 (aq)- +
3BaSO4(s) . What is the...
asked 10 months ago -
Suppose that Savneet is considering increasing her
recent random sample from 20 car rentals to 40...
asked 10 months ago -
Trucks arrive at an unloading terminal at an average rate of 120
per hour.
Trucks arrive...
asked 10 months ago -
Why are methanol and ethanol completely soluble in water while
octanol is not very little soluble....
asked 10 months ago -
A facilities manager at a university reads in a research report
that the mean amount of...
asked 10 months ago -
When the CuSO4 is rehydrated by adding water to the anhydrous
compound, is this an endothermic...
asked 10 months ago -
A ray of sunlight is passing from diamond into crown glass; the
angle of incidence is...
asked 10 months ago -
A block of mass 0.249 kg is placed on top of a light, vertical
spring of...
asked 10 months ago -
how do the kidneys compensate in the presences of acidosis
a) trigger hyperventilate
b) reserve acid...
asked 10 months ago -
Question 501 pts
The rental rate of capital to the firm increases. Which of the
following...
asked 10 months ago