
Homework Answers
a)Applying chi square test:
| Expected | Ei=row total*column total/grand total | white | Black | Total |
| section A | 81.0573 | 18.9427 | 100 | |
| section B | 102.9427 | 24.0573 | 127 | |
| total | 184 | 43 | 227 | |
| chi square χ2 | =(Oi-Ei)2/Ei | white | Black | Total |
| section A | 0.5947 | 2.5446 | 3.1393 | |
| section B | 0.4682 | 2.0036 | 2.4719 | |
| total | 1.0629 | 4.5482 | 5.6111 |
| test statistic X2 = | 5.611 | |
| p value = | 0.018 | |
b)
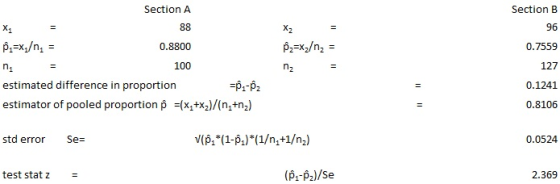
fom above test statistic z =2.37
p value =0.018
Add Answer to:
New Renters A complex is divided into two parts: Section A and Section B. The plaintiffs...
A complex is divided into two parts: Section A and Section B. The plaintiffs in a...
 A complex is divided into two parts: Section A and Section B. The plaintiffs in a lawsuit claimed that white potential renters were steered to section A, while black renters were steered to section B. The table displays the locations of recently rented apartments. Do you think there is evidence of a racial bias? Assume the conditions for inference are satisfied. Complete parts a through c. New Renters Black White Total Section A Section B Total NOTE: With respect, this...
A complex is divided into two parts: Section A and Section B. The plaintiffs in a...
 A complex is divided into two parts: Section A and Section B. The plaintiffs in a lawsuit claimed that white potential renters were steered to section A, while black renters were steered to section B. The table displays the locations of recently rented apartments. Do you think there is evidence of a racial bias? Assume the conditions for inference are satisfied. Complete parts a through c. New Renters White 92 78 170 Total 103 109 212 Black NOTE: With respect,...
Perform a chi-square homogeneity test. An independent simple random sample of residents in three regions gave...
 Perform a chi-square homogeneity test. An independent simple random sample of residents in three regions gave the data on race shown in the table. At the 1% signifcance level, do the data provide sufficient evidence to conclude that a difference exists in race distributions among the three regions? White Black Other Total 91 Midwest West East 14 114 117 16 10 143 115 16 139 Total 396 323 38 35 What are the null and alternative hypotheses? OA H: The...
Chapter 5, Section 1, Exercise 013 Find the p-value based on a standard normal distribution for each of the following standardized test statistics (a) Z = 0.89 for a right tail test for a difference...
 Chapter 5, Section 1, Exercise 013 Find the p-value based on a standard normal distribution for each of the following standardized test statistics (a) Z = 0.89 for a right tail test for a difference in two proportions Round your answer to two decimal places p-value0.20 the absolute tolerance is +/-0.01 (b) Z-_2.39 for a left tail test for a difference in two means Round your answer to three decimal places. p-value- the absolute tolerance is +/-0.001 (c) = 2.18...
Professor Fair believes that extra time does not improve grades on exams. He randomly divided a...
Professor Fair believes that extra time does not improve grades on exams. He randomly divided a group of 300 students into two groups and gave them all the same test. One group had exactly 1 hour in which to finish the test, and the other group could stay as long as desired. The results are shown in the following table. Test at the 0.01 level of significance that time to complete a test and test results are independent. Time A...
PRI NIER VERSION BACK NEXI Chapter 7, Section 1, Exercise 006 The categories of a categorical...
 PRI NIER VERSION BACK NEXI Chapter 7, Section 1, Exercise 006 The categories of a categorical variable are given along with the observed counts from a sample. The expected counts from a null hypothesis are given in parentheses. Compute the x-test statistic, and use the x-distribution to find the p-value of the test. Category Observed 59 (50) 31 (50) 60 (50) Round your answer for the chi-square statistic to two decimal places, and your answer for the p-value to four...
A study was conducted to determine the proportion of people who dream in black and white...
 A study was conducted to determine the proportion of people who dream in black and white instead of color. Among 318 people over the age of 55, 79 dream in black and white, and among 314 people under the age of 25, 13 dream in black and white. Use a 0.05 significance level to test the claim that the proportion of people over 55 who dream in black and white is greater than the proportion for those under 25. Complete...
The following table shows site type and type of pottery for a random sample of 628...
 The following table shows site type and type of pottery for a random sample of 628 sherds at an archaeological location. Pottery Type Mesa Verde McElmo Mancos Site Type Black White Black-on-White Row Total Black-on-White | Mesa Top 77T 189 Cliff-Talus 81 213 Canyon Bench 226 Column Total 248 207 173 628 Use a chi-square test to determine if site type and pottery type are independent at the 0.01 level of significance. (a) What is the level of significance? -...
3. Consider the following hypotheses and sample data, and then complete parts a and b below...
 3. Consider the following hypotheses and sample data, and then complete parts a and b below using ?: 0.10. H1:H16 19 20 12 17 20 22 13 23 19 13 a) What conclusion should be drawn? Determine the critical value(s) The critical value(s) is(are) (Round to three decimal places as needed. Use a comma to separate answers as needed.) Determine the test statistic, t (Round to two decimal places as needed.) What conclusion should be drawn? O A. Do not...
Two processes for manufacturing large roller bearings are under study. In both cases, the diameters (in...
Two processes for manufacturing large roller bearings are under study. In both cases, the diameters (in centimeters) are being examined. A random sample of 26 roller bearings from the old manufacturing process showed the sample variance of diameters to be s2 = 0.231. Another random sample of 28 roller bearings from the new manufacturing process showed the sample variance of their diameters to be s2 = 0.146. Use a 5% level of significance to test the claim that there is...
 A complex is divided into two parts: Section A and Section B. The plaintiffs in a lawsuit claimed that white potential renters were steered to section A, while black renters were steered to section B. The table displays the locations of recently rented apartments. Do you think there is evidence of a racial bias? Assume the conditions for inference are satisfied. Complete parts a through c. New Renters Black White Total Section A Section B Total NOTE: With respect, this...
 A complex is divided into two parts: Section A and Section B. The plaintiffs in a lawsuit claimed that white potential renters were steered to section A, while black renters were steered to section B. The table displays the locations of recently rented apartments. Do you think there is evidence of a racial bias? Assume the conditions for inference are satisfied. Complete parts a through c. New Renters White 92 78 170 Total 103 109 212 Black NOTE: With respect,...
 Perform a chi-square homogeneity test. An independent simple random sample of residents in three regions gave the data on race shown in the table. At the 1% signifcance level, do the data provide sufficient evidence to conclude that a difference exists in race distributions among the three regions? White Black Other Total 91 Midwest West East 14 114 117 16 10 143 115 16 139 Total 396 323 38 35 What are the null and alternative hypotheses? OA H: The...
 Chapter 5, Section 1, Exercise 013 Find the p-value based on a standard normal distribution for each of the following standardized test statistics (a) Z = 0.89 for a right tail test for a difference in two proportions Round your answer to two decimal places p-value0.20 the absolute tolerance is +/-0.01 (b) Z-_2.39 for a left tail test for a difference in two means Round your answer to three decimal places. p-value- the absolute tolerance is +/-0.001 (c) = 2.18...
 PRI NIER VERSION BACK NEXI Chapter 7, Section 1, Exercise 006 The categories of a categorical variable are given along with the observed counts from a sample. The expected counts from a null hypothesis are given in parentheses. Compute the x-test statistic, and use the x-distribution to find the p-value of the test. Category Observed 59 (50) 31 (50) 60 (50) Round your answer for the chi-square statistic to two decimal places, and your answer for the p-value to four...
 A study was conducted to determine the proportion of people who dream in black and white instead of color. Among 318 people over the age of 55, 79 dream in black and white, and among 314 people under the age of 25, 13 dream in black and white. Use a 0.05 significance level to test the claim that the proportion of people over 55 who dream in black and white is greater than the proportion for those under 25. Complete...
 The following table shows site type and type of pottery for a random sample of 628 sherds at an archaeological location. Pottery Type Mesa Verde McElmo Mancos Site Type Black White Black-on-White Row Total Black-on-White | Mesa Top 77T 189 Cliff-Talus 81 213 Canyon Bench 226 Column Total 248 207 173 628 Use a chi-square test to determine if site type and pottery type are independent at the 0.01 level of significance. (a) What is the level of significance? -...
 3. Consider the following hypotheses and sample data, and then complete parts a and b below using ?: 0.10. H1:H16 19 20 12 17 20 22 13 23 19 13 a) What conclusion should be drawn? Determine the critical value(s) The critical value(s) is(are) (Round to three decimal places as needed. Use a comma to separate answers as needed.) Determine the test statistic, t (Round to two decimal places as needed.) What conclusion should be drawn? O A. Do not...
Most questions answered within 3 hours.
-
Where is the error in this code sequence?
String s1 = "Hello";
String s2 = "ello";...
asked 10 months ago -
Financial data for Joel de Paris, Inc., for last year
follow:
Joel de Paris, Inc.
Balance...
asked 10 months ago -
Consider this reaction:
Al2(SO4)3 (aq)+ BaCl3
(aq) Al2Cl6 (aq)- +
3BaSO4(s) . What is the...
asked 10 months ago -
Suppose that Savneet is considering increasing her
recent random sample from 20 car rentals to 40...
asked 10 months ago -
Trucks arrive at an unloading terminal at an average rate of 120
per hour.
Trucks arrive...
asked 10 months ago -
Why are methanol and ethanol completely soluble in water while
octanol is not very little soluble....
asked 10 months ago -
A facilities manager at a university reads in a research report
that the mean amount of...
asked 10 months ago -
When the CuSO4 is rehydrated by adding water to the anhydrous
compound, is this an endothermic...
asked 10 months ago -
A ray of sunlight is passing from diamond into crown glass; the
angle of incidence is...
asked 10 months ago -
A block of mass 0.249 kg is placed on top of a light, vertical
spring of...
asked 10 months ago -
how do the kidneys compensate in the presences of acidosis
a) trigger hyperventilate
b) reserve acid...
asked 10 months ago -
Question 501 pts
The rental rate of capital to the firm increases. Which of the
following...
asked 10 months ago