
Homework Answers
Add Answer to:
Question 3 Suppose that in an experiment to estimate the population mean i, a random sample...
For a random sample of 36 data pairs, the sample mean of the differences was 0.72....
 For a random sample of 36 data pairs, the sample mean of the differences was 0.72. The sample standard deviation of the differences was 2. At the 5% level of significance, test the claim that the population mean of the differences is different from 0. (a) Is it appropriate to use a Student's t distribution for the sample test statistic? Explain. No, the sample size is not larger than 30. Yes, the sample size is larger than 30. No, the...
A simple random sample of szen 15 is drawn from a population that is normally distributed....
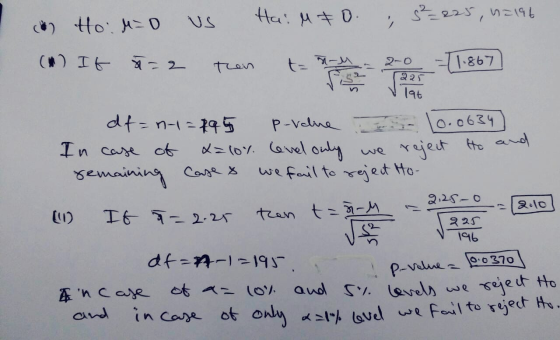
 A simple random sample of szen 15 is drawn from a population that is normally distributed. The sample mean is found to be x 20.1 and the sample standard deviation is found to be 3 6.3. Determine if the population mean is different from 26 at the 0.01 level of significance. Complete parts (a) through (d) below. (a) Determine the null and alternative hypotheses. Ho H (b) Calculate the P-value P-value (Round to three decimal places as needed.) (c) State...
A random sample of size 16 from a normal distribution with mu=3 produced a sample mean...
A random sample of size 16 from a normal distribution with mu=3 produced a sample mean of 4.5. a. Is the x distrobution normal? explain b. compute the sample test statistic z under the null hypothesis Ho: mu =6.3 c. For H1: mu <6.3, estimate the P-value of the test statistic d. For a level of significance of 0.01 and the hypothesis of parts (b) and (c), do you reject or fail to reject the null hypothesis? explain.
A simple random sample of size n=40 is drawn from a population. The sample mean is...
A simple random sample of size n=40 is drawn from a population. The sample mean is found to be 106.9,and the sample standard deviation is found to be 15.1. Is the population mean greater than 100 at the α=0.025 level of significance? A) Determine the null and alternative hypotheses. B) Compute the test statistic C) Determine the P-value. (Round to three decimal places as needed.) D) What is the result of the hypothesis test? ____ the null hypothesis because the...
In order to conduct a hypothesis test for the population mean, a random sample of 28...
 In order to conduct a hypothesis test for the population mean, a random sample of 28 observations is drawn from a normally distributed population. The resulting sample mean and sample standard deviation are calculated as 17.9 and 1.5, respectively. (You may find it useful to reference the appropriate table: z table or t table). HO: MS 17.5 against HA: > 17.5 a-1. Calculate the value of the test statistic. (Round all intermediate calculations to at least 4 decimal places and...
A simple random sample of size n= 15 is drawn from a population that is normally...
 A simple random sample of size n= 15 is drawn from a population that is normally distributed. The sample mean is found to be x = 22.8 and the sample standard deviation is found to be s = 6.3. Determine if the population mean is different from 25 at the a= 0.01 level of significance. Complete parts (a) through (d) below. (a) Determine the null and alternative hypotheses. Ho 25 H: V25 (b) Calculate the P-value. P-value = (Round to...
A random sample of leading companies in South Korea gave the following percentage yields based on...
A random sample of leading companies in South Korea gave the following percentage yields based on assets. 2.1 2.3 4.2 1.9 0.5 3.6 2.4 0.2 1.7 1.8 1.4 5.4 1.1 Use a calculator to verify that s2 ≈ 2.125 for these South Korean companies. Another random sample of leading companies in Sweden gave the following percentage yields based on assets. 2.2 3.8 3.9 1.1 3.9 2.8 2.3 3.5 2.8 Use a calculator to verify that s2 ≈ 0.909 for these...
A random sample of 100 observations from a population with standard deviation 76 yielded a sample...
 A random sample of 100 observations from a population with standard deviation 76 yielded a sample mean of 114. Complete parts a through c below. a. Test the null hypothesis that u = 100 against the alternative hypothesis that u > 100, using a = 0.05. Interpret the results of the test. What is the value of the test statistic? und to two decimal places as needed.) Find the p-value. p-value = (Round to three decimal places as needed.) State...
A random sample is obtained from a population with variance = 400 and the sample mean...
A random sample is obtained from a population with variance = 400 and the sample mean is computed to be 70. Consider the null hypothesis Ho: µ = 80 versus the alternative H1: Ho: µ < 80. Compute the p-value. If n = 16, the p-value is ?
In order to conduct a hypothesis test for the population mean, a random sample of 28...
 In order to conduct a hypothesis test for the population mean, a random sample of 28 observations is drawn from a normally distributed population. The resulting sample mean and sample standard deviation are calculated as 17.9 and 1.5, respectively. (You may find it useful to reference the appropriate table: z table or t table) H0 : μ 17.5 against HA: μ > 17.5 a-1. Calculate the value of the test statistic. (Round all intermediate calculations to at least 4 decimal...
 For a random sample of 36 data pairs, the sample mean of the differences was 0.72. The sample standard deviation of the differences was 2. At the 5% level of significance, test the claim that the population mean of the differences is different from 0. (a) Is it appropriate to use a Student's t distribution for the sample test statistic? Explain. No, the sample size is not larger than 30. Yes, the sample size is larger than 30. No, the...
 A simple random sample of szen 15 is drawn from a population that is normally distributed. The sample mean is found to be x 20.1 and the sample standard deviation is found to be 3 6.3. Determine if the population mean is different from 26 at the 0.01 level of significance. Complete parts (a) through (d) below. (a) Determine the null and alternative hypotheses. Ho H (b) Calculate the P-value P-value (Round to three decimal places as needed.) (c) State...
 In order to conduct a hypothesis test for the population mean, a random sample of 28 observations is drawn from a normally distributed population. The resulting sample mean and sample standard deviation are calculated as 17.9 and 1.5, respectively. (You may find it useful to reference the appropriate table: z table or t table). HO: MS 17.5 against HA: > 17.5 a-1. Calculate the value of the test statistic. (Round all intermediate calculations to at least 4 decimal places and...
 A simple random sample of size n= 15 is drawn from a population that is normally distributed. The sample mean is found to be x = 22.8 and the sample standard deviation is found to be s = 6.3. Determine if the population mean is different from 25 at the a= 0.01 level of significance. Complete parts (a) through (d) below. (a) Determine the null and alternative hypotheses. Ho 25 H: V25 (b) Calculate the P-value. P-value = (Round to...
 A random sample of 100 observations from a population with standard deviation 76 yielded a sample mean of 114. Complete parts a through c below. a. Test the null hypothesis that u = 100 against the alternative hypothesis that u > 100, using a = 0.05. Interpret the results of the test. What is the value of the test statistic? und to two decimal places as needed.) Find the p-value. p-value = (Round to three decimal places as needed.) State...
 In order to conduct a hypothesis test for the population mean, a random sample of 28 observations is drawn from a normally distributed population. The resulting sample mean and sample standard deviation are calculated as 17.9 and 1.5, respectively. (You may find it useful to reference the appropriate table: z table or t table) H0 : μ 17.5 against HA: μ > 17.5 a-1. Calculate the value of the test statistic. (Round all intermediate calculations to at least 4 decimal...
Most questions answered within 3 hours.
-
Where is the error in this code sequence?
String s1 = "Hello";
String s2 = "ello";...
asked 10 months ago -
Financial data for Joel de Paris, Inc., for last year
follow:
Joel de Paris, Inc.
Balance...
asked 10 months ago -
Consider this reaction:
Al2(SO4)3 (aq)+ BaCl3
(aq) Al2Cl6 (aq)- +
3BaSO4(s) . What is the...
asked 10 months ago -
Suppose that Savneet is considering increasing her
recent random sample from 20 car rentals to 40...
asked 10 months ago -
Trucks arrive at an unloading terminal at an average rate of 120
per hour.
Trucks arrive...
asked 10 months ago -
Why are methanol and ethanol completely soluble in water while
octanol is not very little soluble....
asked 10 months ago -
A facilities manager at a university reads in a research report
that the mean amount of...
asked 10 months ago -
When the CuSO4 is rehydrated by adding water to the anhydrous
compound, is this an endothermic...
asked 10 months ago -
A ray of sunlight is passing from diamond into crown glass; the
angle of incidence is...
asked 10 months ago -
A block of mass 0.249 kg is placed on top of a light, vertical
spring of...
asked 10 months ago -
how do the kidneys compensate in the presences of acidosis
a) trigger hyperventilate
b) reserve acid...
asked 10 months ago -
Question 501 pts
The rental rate of capital to the firm increases. Which of the
following...
asked 10 months ago