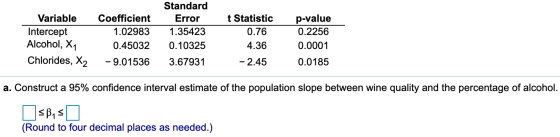
The production of wine is a multi-billion-dollar worldwide industry. In an attempt to develop a model of wine quality as judged by wine experts, data was collected from red wine variants from a particular type of foreign wine. A multiple linear regression model was developed from a sample of 45 wines. The model was used to predict wine quality, measured on a scale from 0 (very bad) to 10 (excellent) based on the alcohol content (%) and the amount of chlorides. Use the accompanying results to complete parts (a) and (b) below.
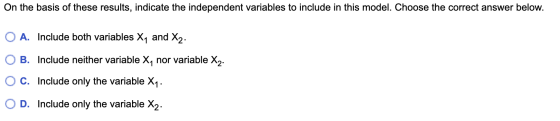
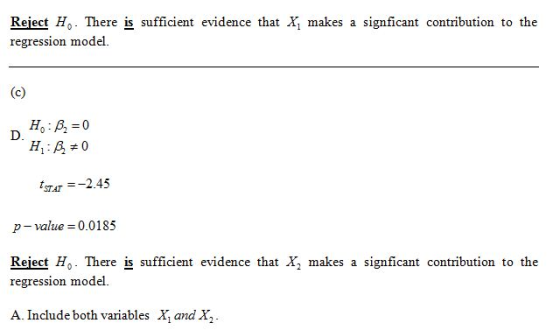
b. At the 0.05 level of significance, determine whether each independent variable makes a significant contribution to the regression model. On the basis of these results, indicate the independent variables to include in this model. Choose the correct hypotheses for X1 below.
 Choose the correct hypotheses fo X2
below.
Choose the correct hypotheses fo X2
below.

Homework Answers

Add Answer to:
The production of wine is a multi-billion-dollar worldwide
industry. In an attempt to develop a model...
The production of wine is a multi-billion-dollar worldwide industry. In an attempt to develop a model...
 The production of wine is a multi-billion-dollar worldwide
industry. In an attempt to develop a model of wine quality as
judged by wine experts, data was collected from red wine variants
from a particular type of foreign wine. A multiple linear
regression model was developed from a sample of 45 wines. The model
was used to predict wine quality, measured on a scale from 0
(very bad) to 10 (excellent) based on the alcohol content (%) and
the amount of...
The production of wine is a multi-billion-dollar worldwide
industry. In an attempt to develop a model of wine quality as
judged by wine experts, data was collected from red wine variants
from a particular type of foreign wine. A multiple linear
regression model was developed from a sample of 45 wines. The model
was used to predict wine quality, measured on a scale from 0
(very bad) to 10 (excellent) based on the alcohol content (%) and
the amount of...
The production of wine is a multibillion dollar worldwide industry. In an attempt to develop a...
 The production of wine is a multibillion dollar worldwide industry. In an attempt to develop a model of wine quality as judged by wine experts, data was collected from red wine variants. A sample of 20 wines is provided in the accompanying table. Develop a multiple linear regression model to predict w ne quality, measured on a scale from 0 very bad to 10 excellent based on a cohol content(%) and the amount of chlo dos. Complete parts a through...
URGENT PLEASE HELP The production of wine is a multibillion-dollar worldwide industry. In an attempt to...
 URGENT PLEASE HELP
The production of wine is a multibillion-dollar worldwide
industry. In an attempt to develop a model of wine quality as
judged by wine experts, data was collected from red wine variants.
A sample of 20 wines is provided in the accompanying table. Develop
a multiple linear regression model to predict wine quality,
measured on a scale from 0 (very bad) to 10 (excellent) based on
alcohol content (%) and the amount of chlorides. Complete parts a
through...
URGENT PLEASE HELP
The production of wine is a multibillion-dollar worldwide
industry. In an attempt to develop a model of wine quality as
judged by wine experts, data was collected from red wine variants.
A sample of 20 wines is provided in the accompanying table. Develop
a multiple linear regression model to predict wine quality,
measured on a scale from 0 (very bad) to 10 (excellent) based on
alcohol content (%) and the amount of chlorides. Complete parts a
through...
The production of wine is a multibillion-dollar worldwide industry. In an attempt to develop a model...
The production of wine is a multibillion-dollar worldwide industry. In an attempt to develop a model of wine quality as judged by wine experts, data was collected from red wine variants. A sample of 20 wines is provided in the accompanying table. Develop a multiple linear regression model to predict wine quality, measured on a scale from 0 (very bad) to 10(excellent) based on alcohol content (%) and the amount of chlorides. Alcohol Chlorides 10.1 0.067 11.8 0.064 9 0.076...
A regression analysis is performed using data for 36 single-family homes to predict appraised value (in...
 A regression analysis is performed using data for 36
single-family homes to predict appraised value (in thousands of
dollars) based on land area of the property (in acres), X1i, and
age (in years), X2i, in month i. Use the results below to
complete parts (a) and (b) below.
Variable
Coefficient
Standard Error
t Statistic
p-value
Intercept
392.60372
51.68272
7.60
0.0000
Area, X1
451.43475
100.48497
4.49
0.0001
Age,X2
−2.17162
0.79077
−2.75
0.0097
a. Construct a 95% confidence interval estimate...
A regression analysis is performed using data for 36
single-family homes to predict appraised value (in thousands of
dollars) based on land area of the property (in acres), X1i, and
age (in years), X2i, in month i. Use the results below to
complete parts (a) and (b) below.
Variable
Coefficient
Standard Error
t Statistic
p-value
Intercept
392.60372
51.68272
7.60
0.0000
Area, X1
451.43475
100.48497
4.49
0.0001
Age,X2
−2.17162
0.79077
−2.75
0.0097
a. Construct a 95% confidence interval estimate...
The production of wine is a multibillion-dollar worldwide industry. In an attempt to develop a model of wine quality as judged by wine experts, data was collected from red wine variants. A sample of 20 wines is provided in the accompanying table. Devel
The production of wine is a multibillion-dollar worldwide industry. In an attempt to develop a model of wine quality as judged by wine experts, data was collected from red wine variants. A sample of 20 wines is provided in the accompanying table. Develop a multiple linear regression model to predict wine quality, measured on a scale from 0 (very bad) to 10 (excellent) based on alcohol content (%) and the amount of chlorides. Complete parts a through g below. Quality Alcohol_Content(%) Chlorides0 7.1 0.0610 7.6 0.0632...
Using 17 observations on each variable, a computer program generated the following multiple regression model: ŷ...
 Using 17 observations on each variable, a computer program generated the following multiple regression model: ŷ = 88.2 +7.03x, + 1.69x2 - 9.84x, If the standard errors of the coefficients of the independent variables are, respectively, 4.78, 0.92, and 3.38 can you conclude that the independent variable X, is needed in the regression model? Let B. By, and B, denote the coefficients of the 3 variables in this model, and use a two-sided hypothesis test and significance level of 0.05...
A hospital would like to develop a regression model to predict the total hospital bill for...
 A hospital would like to develop a regression model to predict the total hospital bill for a patient based on his or her length of stay, number of days in the hospitais intensive care una (CU), and age of the patient Data for these variables can be found in the accompanying table Complete parts (a) through (e) below. Click the icon to view the data table a) Using technology, construct a regression model using all three independent variables, where y...
1. A professor examined the relationship between the number of hours devoted to reading, each week...
 1. A professor examined the relationship between the number of hours devoted to reading, each week Y and the independent variable social class X1), the number of years of school completed x2 and reading speed X3, in pages read per hour. The following ANOVA table obtained from a stepwise regression procedure for a sample of 19 women over 60. A) Fill in the missing values. DESS Source Regression x3 MS P value 1 1058.628 Residual 585.02 Regression X2 X3 183.743...
1. One Price Realty Company wants to develop a model to estimate the value of houses in its inventory The office manager has decided to develop a multiple regression model to help explain the va...
 1. One Price Realty Company wants to develop a model to estimate the value of houses in its inventory The office manager has decided to develop a multiple regression model to help explain the variation in house values. (25 points) The office manager has chosen the following variables to develop the model: X1 square feet X2- age in years x3- dummy variable for house style (1 if ranch, 0 if not) X4-2d dummy variable for house style (I if split...
 The production of wine is a multi-billion-dollar worldwide
industry. In an attempt to develop a model of wine quality as
judged by wine experts, data was collected from red wine variants
from a particular type of foreign wine. A multiple linear
regression model was developed from a sample of 45 wines. The model
was used to predict wine quality, measured on a scale from 0
(very bad) to 10 (excellent) based on the alcohol content (%) and
the amount of...
The production of wine is a multi-billion-dollar worldwide
industry. In an attempt to develop a model of wine quality as
judged by wine experts, data was collected from red wine variants
from a particular type of foreign wine. A multiple linear
regression model was developed from a sample of 45 wines. The model
was used to predict wine quality, measured on a scale from 0
(very bad) to 10 (excellent) based on the alcohol content (%) and
the amount of...
 The production of wine is a multibillion dollar worldwide industry. In an attempt to develop a model of wine quality as judged by wine experts, data was collected from red wine variants. A sample of 20 wines is provided in the accompanying table. Develop a multiple linear regression model to predict w ne quality, measured on a scale from 0 very bad to 10 excellent based on a cohol content(%) and the amount of chlo dos. Complete parts a through...
 URGENT PLEASE HELP
The production of wine is a multibillion-dollar worldwide
industry. In an attempt to develop a model of wine quality as
judged by wine experts, data was collected from red wine variants.
A sample of 20 wines is provided in the accompanying table. Develop
a multiple linear regression model to predict wine quality,
measured on a scale from 0 (very bad) to 10 (excellent) based on
alcohol content (%) and the amount of chlorides. Complete parts a
through...
URGENT PLEASE HELP
The production of wine is a multibillion-dollar worldwide
industry. In an attempt to develop a model of wine quality as
judged by wine experts, data was collected from red wine variants.
A sample of 20 wines is provided in the accompanying table. Develop
a multiple linear regression model to predict wine quality,
measured on a scale from 0 (very bad) to 10 (excellent) based on
alcohol content (%) and the amount of chlorides. Complete parts a
through...
 A regression analysis is performed using data for 36
single-family homes to predict appraised value (in thousands of
dollars) based on land area of the property (in acres), X1i, and
age (in years), X2i, in month i. Use the results below to
complete parts (a) and (b) below.
Variable
Coefficient
Standard Error
t Statistic
p-value
Intercept
392.60372
51.68272
7.60
0.0000
Area, X1
451.43475
100.48497
4.49
0.0001
Age,X2
−2.17162
0.79077
−2.75
0.0097
a. Construct a 95% confidence interval estimate...
A regression analysis is performed using data for 36
single-family homes to predict appraised value (in thousands of
dollars) based on land area of the property (in acres), X1i, and
age (in years), X2i, in month i. Use the results below to
complete parts (a) and (b) below.
Variable
Coefficient
Standard Error
t Statistic
p-value
Intercept
392.60372
51.68272
7.60
0.0000
Area, X1
451.43475
100.48497
4.49
0.0001
Age,X2
−2.17162
0.79077
−2.75
0.0097
a. Construct a 95% confidence interval estimate...
 Using 17 observations on each variable, a computer program generated the following multiple regression model: ŷ = 88.2 +7.03x, + 1.69x2 - 9.84x, If the standard errors of the coefficients of the independent variables are, respectively, 4.78, 0.92, and 3.38 can you conclude that the independent variable X, is needed in the regression model? Let B. By, and B, denote the coefficients of the 3 variables in this model, and use a two-sided hypothesis test and significance level of 0.05...
 A hospital would like to develop a regression model to predict the total hospital bill for a patient based on his or her length of stay, number of days in the hospitais intensive care una (CU), and age of the patient Data for these variables can be found in the accompanying table Complete parts (a) through (e) below. Click the icon to view the data table a) Using technology, construct a regression model using all three independent variables, where y...
 1. A professor examined the relationship between the number of hours devoted to reading, each week Y and the independent variable social class X1), the number of years of school completed x2 and reading speed X3, in pages read per hour. The following ANOVA table obtained from a stepwise regression procedure for a sample of 19 women over 60. A) Fill in the missing values. DESS Source Regression x3 MS P value 1 1058.628 Residual 585.02 Regression X2 X3 183.743...
 1. One Price Realty Company wants to develop a model to estimate the value of houses in its inventory The office manager has decided to develop a multiple regression model to help explain the variation in house values. (25 points) The office manager has chosen the following variables to develop the model: X1 square feet X2- age in years x3- dummy variable for house style (1 if ranch, 0 if not) X4-2d dummy variable for house style (I if split...
Most questions answered within 3 hours.
-
Where is the error in this code sequence?
String s1 = "Hello";
String s2 = "ello";...
asked 11 months ago -
Financial data for Joel de Paris, Inc., for last year
follow:
Joel de Paris, Inc.
Balance...
asked 11 months ago -
Consider this reaction:
Al2(SO4)3 (aq)+ BaCl3
(aq) Al2Cl6 (aq)- +
3BaSO4(s) . What is the...
asked 11 months ago -
Suppose that Savneet is considering increasing her
recent random sample from 20 car rentals to 40...
asked 11 months ago -
Trucks arrive at an unloading terminal at an average rate of 120
per hour.
Trucks arrive...
asked 11 months ago -
Why are methanol and ethanol completely soluble in water while
octanol is not very little soluble....
asked 11 months ago -
A facilities manager at a university reads in a research report
that the mean amount of...
asked 11 months ago -
When the CuSO4 is rehydrated by adding water to the anhydrous
compound, is this an endothermic...
asked 11 months ago -
A ray of sunlight is passing from diamond into crown glass; the
angle of incidence is...
asked 11 months ago -
A block of mass 0.249 kg is placed on top of a light, vertical
spring of...
asked 11 months ago -
how do the kidneys compensate in the presences of acidosis
a) trigger hyperventilate
b) reserve acid...
asked 11 months ago -
Question 501 pts
The rental rate of capital to the firm increases. Which of the
following...
asked 11 months ago