
![1.6. Real Gross Domestic Product, Chained Dollars llonesised on: December 21, 2018- Next Release Date January 30, 2019 ined (2012) dollars] Seasonally adjusted at annual rates 2018 Q3 18,665.0 12,953.3 4,585.5 1,677.4 2,919.2 Line Gross domestie product 2 Personal consumption expenditures 3 Goods Durable goods 5 Nondurable goods](http://img.homeworklib.com/questions/28c86d40-6f66-11ea-9e00-a322b02c5b36.png?x-oss-process=image/resize,w_560)
Homework Answers
Assume 2017 as base year
for year 2017 =( 18120.8/18120.8 )*100= 100
for 2018 = (18665/18120.8)*100 = 103
Annual inflation rate = (value 2018/value 2017)-1)*100
Annual inflation rate = ((103/100)-1)*100
Annual inflation rate = (1.03-1)*100 = 3%
Add Answer to:
Compute the annual rate of inflation in the GDP deflator between
the two periods (the circled...
1. Using the data available and applying the Compound Annual Percent Change formula, compute the annual...
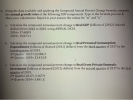 1. Using the data available and applying the Compound Annual Percent Change formula, compute the annual growth rates of the following GDP components. Type in the formula you use & show your calculations. Report in your answer the values for "m" and "n." a. Calculate the compound annual percent change in Real GDP (billions of (2012) chained dollars) from 2016 to 2019, using ANNUAL DATA. 2016= 17,688.9 2019= 19,073.1 b. Calculate the compound annual percent change in Real Personal Consumption...
MUST BE 2017 Data exercise #1 Part 1: Expenditures Approach to Calculating GDP (weight 25% of...
MUST BE 2017 Data exercise #1 Part 1: Expenditures Approach to Calculating GDP (weight 25% of the assignment grade) Complete the following exercise Visit the Bureau of Economic Analysis website at www.bea.gov. From the drop-down menu under “Data”, click on “by Economics Account”. Then click on “National”, “Gross Domestic Product, and “Full Release and Tables”. Use table 3 (Gross Domestic Product: Level and Change from Preceding Period). The left columns are nominal GDP (and its components) and the right half...
Part 1: Expenditures Approach to Calculating GDP (weight 25% of the assignment grade) Complete the following...
Part 1: Expenditures Approach to Calculating GDP (weight 25% of the assignment grade) Complete the following exercise. Visit the Bureau of Economic Analysis website at www.bea.gov. From the drop-down menu under “Data”, click on “by Economics Account”. Then click on “National”, “Gross Domestic Product, and “Full Release and Tables”. Use table 3 (Gross Domestic Product: Level and Change from Preceding Period). The left columns are nominal GDP (and its components) and the right half represents real GDP (chained 2012 dollars)...
**This question has been asked and answered once already with OLD data, please note you will...
 **This question has been asked and answered once already
with OLD data, please note you will need to visit the website below
as stated in the question or go by the table/chart provided at the
bottom**
Visit the Bureau of Economics Analysis website at www.bea.gov. From
the drop-down menu under "Data", click on "by Economics Account".
Then click on "National", "Gross Domestic Product" and "Full
Release and Tables". Use table 3 (Gross Domestic Product: Level and
Change from Preceding Period)....
**This question has been asked and answered once already
with OLD data, please note you will need to visit the website below
as stated in the question or go by the table/chart provided at the
bottom**
Visit the Bureau of Economics Analysis website at www.bea.gov. From
the drop-down menu under "Data", click on "by Economics Account".
Then click on "National", "Gross Domestic Product" and "Full
Release and Tables". Use table 3 (Gross Domestic Product: Level and
Change from Preceding Period)....
Alejandra is Calculating the nondurable goods value for 2017. She is calculating the value by using...
Alejandra is Calculating the nondurable goods value for 2017. She is calculating the value by using the quantity of each final nondurable goods produced in 2017, multiplied by the price at which the nondurable goods were sold in 2017. What type of calculation is Alejandra creating? The nondurable goods nominal values. The nondurable goods nominal and real values. The nondurable goods real values Gross Domestic Product (GDP) is designed to measure: a nation’s total imports of final goods and services...
GDP and the Measurement of ALFRED i Progress - Ask FRED 12,000 The accompanying graph depicts...
 GDP and the Measurement of ALFRED i Progress - Ask FRED 12,000 The accompanying graph depicts the components of quarterly Real GDP in the United States measured in billions of dollars: O 10,000 8,000 Real Personal Consumption Expenditures Vintage: 2017-12 21 Q1 2010 9,917.689 6,000 GDP = C + I + G + NX 4,000 Real Government Consumption Q1 2010 3,084.280 Expenditures and Gross Investment Vintage: 2018-01-23: Real Gross Private Domestic 1 2010 2,012.899 Investment Vintage: 2018-01-23: Net Exports of...
• 1. What are the quarterly growth rates (Percentage Change From Preceding Period in Real Gross...
 • 1. What are the quarterly growth rates (Percentage Change From Preceding Period in Real Gross Domestic Product) for the U.S. economy for the last six quarters? Report those numbers in your submission 2. What is the average of those 6 quarters? . 3. Is the average of those growth rates above or below the long-run U.S. annual growth rate of 3.5 percent? Bureau of Economke Analysis Table 1.1.1. Percent Change From Preceding Period in Real Gross Domestic Product Percent...
Economic: Please assist me with these. I am a bit confused about the information asked from...
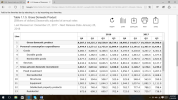 Economic: Please assist me with these. I am a bit confused about
the information asked from the given data and table 1.1.5. What are
the value i should be looking at? This is the most recent GDP NIPA
table released as you can see. Are the questions asked in the quiz
only about Q3 as the table itself doesn't show quarter 4 . (Note:
the table NIPA 1.1.5 can be slide from left to right and from up to
don....
Economic: Please assist me with these. I am a bit confused about
the information asked from the given data and table 1.1.5. What are
the value i should be looking at? This is the most recent GDP NIPA
table released as you can see. Are the questions asked in the quiz
only about Q3 as the table itself doesn't show quarter 4 . (Note:
the table NIPA 1.1.5 can be slide from left to right and from up to
don....
&nb
Normal Real Items Q3 2018 (billions of dollars) Gross domestic product 20,658.20 153.40 Personal consumption expenditures 14,050.50 111.30 Gross private domestic investment 3,710.70 119.40 Net exports of goods and services -653.50 -108.70 Government consumption expenditures and gross investment 3,550.50 20.20 1. b) Calculate the percentage (the proportion) of each category in nominal GDP and in real GDP. Using Nominal GDP: [Personal consumption expenditures / Nominal GDP]*100% [Gross private domestic investment / Nominal GDP]*100% [Net exports of goods and services /...
Using Table 7 and Table 8 (attached below), create a table that contains the following information...
 Using Table 7 and Table 8 (attached below), create a table that
contains the following information for the last year quarterly
(Q3):
Gross domestic product
Gross national product
Net national product
National income
Personal income
Use the data to answer:
1. What is the difference gross domestic product (GDP) and gross
national product (GNP)? What is the difference in what GDP measures
compared to GNP?
2. Based on the table, what calculations must you make to determine
GNP from GDP?...
Using Table 7 and Table 8 (attached below), create a table that
contains the following information for the last year quarterly
(Q3):
Gross domestic product
Gross national product
Net national product
National income
Personal income
Use the data to answer:
1. What is the difference gross domestic product (GDP) and gross
national product (GNP)? What is the difference in what GDP measures
compared to GNP?
2. Based on the table, what calculations must you make to determine
GNP from GDP?...
 1. Using the data available and applying the Compound Annual Percent Change formula, compute the annual growth rates of the following GDP components. Type in the formula you use & show your calculations. Report in your answer the values for "m" and "n." a. Calculate the compound annual percent change in Real GDP (billions of (2012) chained dollars) from 2016 to 2019, using ANNUAL DATA. 2016= 17,688.9 2019= 19,073.1 b. Calculate the compound annual percent change in Real Personal Consumption...
 **This question has been asked and answered once already
with OLD data, please note you will need to visit the website below
as stated in the question or go by the table/chart provided at the
bottom**
Visit the Bureau of Economics Analysis website at www.bea.gov. From
the drop-down menu under "Data", click on "by Economics Account".
Then click on "National", "Gross Domestic Product" and "Full
Release and Tables". Use table 3 (Gross Domestic Product: Level and
Change from Preceding Period)....
**This question has been asked and answered once already
with OLD data, please note you will need to visit the website below
as stated in the question or go by the table/chart provided at the
bottom**
Visit the Bureau of Economics Analysis website at www.bea.gov. From
the drop-down menu under "Data", click on "by Economics Account".
Then click on "National", "Gross Domestic Product" and "Full
Release and Tables". Use table 3 (Gross Domestic Product: Level and
Change from Preceding Period)....
 GDP and the Measurement of ALFRED i Progress - Ask FRED 12,000 The accompanying graph depicts the components of quarterly Real GDP in the United States measured in billions of dollars: O 10,000 8,000 Real Personal Consumption Expenditures Vintage: 2017-12 21 Q1 2010 9,917.689 6,000 GDP = C + I + G + NX 4,000 Real Government Consumption Q1 2010 3,084.280 Expenditures and Gross Investment Vintage: 2018-01-23: Real Gross Private Domestic 1 2010 2,012.899 Investment Vintage: 2018-01-23: Net Exports of...
 • 1. What are the quarterly growth rates (Percentage Change From Preceding Period in Real Gross Domestic Product) for the U.S. economy for the last six quarters? Report those numbers in your submission 2. What is the average of those 6 quarters? . 3. Is the average of those growth rates above or below the long-run U.S. annual growth rate of 3.5 percent? Bureau of Economke Analysis Table 1.1.1. Percent Change From Preceding Period in Real Gross Domestic Product Percent...
 Economic: Please assist me with these. I am a bit confused about
the information asked from the given data and table 1.1.5. What are
the value i should be looking at? This is the most recent GDP NIPA
table released as you can see. Are the questions asked in the quiz
only about Q3 as the table itself doesn't show quarter 4 . (Note:
the table NIPA 1.1.5 can be slide from left to right and from up to
don....
Economic: Please assist me with these. I am a bit confused about
the information asked from the given data and table 1.1.5. What are
the value i should be looking at? This is the most recent GDP NIPA
table released as you can see. Are the questions asked in the quiz
only about Q3 as the table itself doesn't show quarter 4 . (Note:
the table NIPA 1.1.5 can be slide from left to right and from up to
don....
 Using Table 7 and Table 8 (attached below), create a table that
contains the following information for the last year quarterly
(Q3):
Gross domestic product
Gross national product
Net national product
National income
Personal income
Use the data to answer:
1. What is the difference gross domestic product (GDP) and gross
national product (GNP)? What is the difference in what GDP measures
compared to GNP?
2. Based on the table, what calculations must you make to determine
GNP from GDP?...
Using Table 7 and Table 8 (attached below), create a table that
contains the following information for the last year quarterly
(Q3):
Gross domestic product
Gross national product
Net national product
National income
Personal income
Use the data to answer:
1. What is the difference gross domestic product (GDP) and gross
national product (GNP)? What is the difference in what GDP measures
compared to GNP?
2. Based on the table, what calculations must you make to determine
GNP from GDP?...
Most questions answered within 3 hours.
-
Where is the error in this code sequence?
String s1 = "Hello";
String s2 = "ello";...
asked 11 months ago -
Financial data for Joel de Paris, Inc., for last year
follow:
Joel de Paris, Inc.
Balance...
asked 11 months ago -
Consider this reaction:
Al2(SO4)3 (aq)+ BaCl3
(aq) Al2Cl6 (aq)- +
3BaSO4(s) . What is the...
asked 11 months ago -
Suppose that Savneet is considering increasing her
recent random sample from 20 car rentals to 40...
asked 11 months ago -
Trucks arrive at an unloading terminal at an average rate of 120
per hour.
Trucks arrive...
asked 11 months ago -
Why are methanol and ethanol completely soluble in water while
octanol is not very little soluble....
asked 11 months ago -
A facilities manager at a university reads in a research report
that the mean amount of...
asked 11 months ago -
When the CuSO4 is rehydrated by adding water to the anhydrous
compound, is this an endothermic...
asked 11 months ago -
A ray of sunlight is passing from diamond into crown glass; the
angle of incidence is...
asked 11 months ago -
A block of mass 0.249 kg is placed on top of a light, vertical
spring of...
asked 11 months ago -
how do the kidneys compensate in the presences of acidosis
a) trigger hyperventilate
b) reserve acid...
asked 11 months ago -
Question 501 pts
The rental rate of capital to the firm increases. Which of the
following...
asked 11 months ago