Discussion-Normal Probability Distributions The probability that an observation taken from a standard normal population will be...
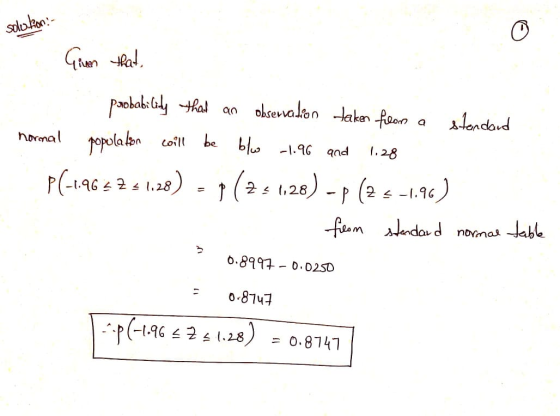
Discussion-Normal Probability Distributions The probability that an observation taken from a standard normal population will be between -1.96 and 1.28 is ? Explain results.
Homework Answers
Add Answer to:
Discussion-Normal Probability Distributions The probability that
an observation taken from a standard normal population will be...
If x is a single observation taken from population has probability density Among possible simple ...
 i need the solution with steps
if x is a single observation taken from population has probability density Among possible simple likelihood ratio tests for testing Ho : θ 0 versus HI :6-1, find the Most powerful test which minimizes the sum of the sizes of the Type I and Type II erors
if x is a single observation taken from population has probability density Among possible simple likelihood ratio tests for testing Ho : θ 0 versus HI :6-1,...
i need the solution with steps
if x is a single observation taken from population has probability density Among possible simple likelihood ratio tests for testing Ho : θ 0 versus HI :6-1, find the Most powerful test which minimizes the sum of the sizes of the Type I and Type II erors
if x is a single observation taken from population has probability density Among possible simple likelihood ratio tests for testing Ho : θ 0 versus HI :6-1,...
If x is a single observation taken from population has probability density function fx(x,0)-28x +...
 i need the solution with steps
If x is a single observation taken from population has probability density function fx(x,0)-28x + 1-0, 0 < x < 1,-1 θ 1 Among all possible simple likelihood ratio tests for testing s the Ho:0 0 versus H:0-1, find the Most powerful test which sum of the sizes of the Type I and Type II errors
If x is a single observation taken from population has probability density function fx(x,0)-28x + 1-0, 0
i need the solution with steps
If x is a single observation taken from population has probability density function fx(x,0)-28x + 1-0, 0 < x < 1,-1 θ 1 Among all possible simple likelihood ratio tests for testing s the Ho:0 0 versus H:0-1, find the Most powerful test which sum of the sizes of the Type I and Type II errors
If x is a single observation taken from population has probability density function fx(x,0)-28x + 1-0, 0
Find the probability that a randomly selected piece of data from a normal population will have...
Find the probability that a randomly selected piece of data from a normal population will have a z-score between 1.28 and 2.25
A random sample of size n = 21, taken from a normal population with a standard...
 A random sample of size n = 21, taken from a normal population with a standard deviation 04 =5, has a mean X4 = 90. A second random sample of size n2 = 37, taken from a different normal population with a standard deviation o2 = 4, has a mean X2 = 39. Find a 94% confidence interval for 11 - H2 Click here to view page 1 of the standard normal distribution table. Click here to view page 2...
find the probability that the sample mean of 16 observations from a standard normal distribution population,...
find the probability that the sample mean of 16 observations from a standard normal distribution population, (normal distribution with u=0 and sigma=1), will be between -0.1 and 0.1
A sample of 46 observations is taken from a normal population with a standard deviation of...
 A sample of 46 observations is taken from a normal population with a standard deviation of 26. The sample mean is 44. Determine the 80% confidence interval for the population mean. (Round the final answers to 3 decimal places.) Confidence interval for the population mean is and
A population has a normal distribution with a mean of 50 and a standard deviation of...
A population has a normal distribution with a mean of 50 and a standard deviation of 10. If a random sample of size 9 is taken from the population, then what is the probability that this sample mean will be between 48 and 54?
. In probability theory, the Normal Distribution (sometimes called a Gaussian Distribution or Bell Curve) is a very common continuous probability distribution. Normal distributions are important...
 . In probability theory, the Normal Distribution (sometimes called a Gaussian Distribution or Bell Curve) is a very common continuous probability distribution. Normal distributions are important in statistics and are often used in the natural and social sciences to represent real-valued random variables whose distributions are not known. Describing the normal distribution using a mathematical function is called a probability distribution function (PDF) which is given here: H The mean of the distribution ơ-The standard deviation f(x)--e 2σ We can...
A random sample of 49 measurements from a population with population standard deviation o 3 had...
 A random sample of 49 measurements from a population with population standard deviation o 3 had a sample mean of x, 9. An independeent random sample of sample mean of x, 11. Test the claim that the population means are 64 measurements from a second population with population standard deviation a2 4 had different. Use level of significance 0.01. (a) What distribution does the sample test statistic follow? Explain. The student's t. We assume that both population distributions are approximately...
What would be the minimum sample size, taken from a normal population with standard deviation 1,...
What would be the minimum sample size, taken from a normal population with standard deviation 1, to ensure we are 95% confident our estimate within .01 of the true population mean?
 i need the solution with steps
if x is a single observation taken from population has probability density Among possible simple likelihood ratio tests for testing Ho : θ 0 versus HI :6-1, find the Most powerful test which minimizes the sum of the sizes of the Type I and Type II erors
if x is a single observation taken from population has probability density Among possible simple likelihood ratio tests for testing Ho : θ 0 versus HI :6-1,...
i need the solution with steps
if x is a single observation taken from population has probability density Among possible simple likelihood ratio tests for testing Ho : θ 0 versus HI :6-1, find the Most powerful test which minimizes the sum of the sizes of the Type I and Type II erors
if x is a single observation taken from population has probability density Among possible simple likelihood ratio tests for testing Ho : θ 0 versus HI :6-1,...
 i need the solution with steps
If x is a single observation taken from population has probability density function fx(x,0)-28x + 1-0, 0 < x < 1,-1 θ 1 Among all possible simple likelihood ratio tests for testing s the Ho:0 0 versus H:0-1, find the Most powerful test which sum of the sizes of the Type I and Type II errors
If x is a single observation taken from population has probability density function fx(x,0)-28x + 1-0, 0
i need the solution with steps
If x is a single observation taken from population has probability density function fx(x,0)-28x + 1-0, 0 < x < 1,-1 θ 1 Among all possible simple likelihood ratio tests for testing s the Ho:0 0 versus H:0-1, find the Most powerful test which sum of the sizes of the Type I and Type II errors
If x is a single observation taken from population has probability density function fx(x,0)-28x + 1-0, 0
 A random sample of size n = 21, taken from a normal population with a standard deviation 04 =5, has a mean X4 = 90. A second random sample of size n2 = 37, taken from a different normal population with a standard deviation o2 = 4, has a mean X2 = 39. Find a 94% confidence interval for 11 - H2 Click here to view page 1 of the standard normal distribution table. Click here to view page 2...
 A sample of 46 observations is taken from a normal population with a standard deviation of 26. The sample mean is 44. Determine the 80% confidence interval for the population mean. (Round the final answers to 3 decimal places.) Confidence interval for the population mean is and
 . In probability theory, the Normal Distribution (sometimes called a Gaussian Distribution or Bell Curve) is a very common continuous probability distribution. Normal distributions are important in statistics and are often used in the natural and social sciences to represent real-valued random variables whose distributions are not known. Describing the normal distribution using a mathematical function is called a probability distribution function (PDF) which is given here: H The mean of the distribution ơ-The standard deviation f(x)--e 2σ We can...
 A random sample of 49 measurements from a population with population standard deviation o 3 had a sample mean of x, 9. An independeent random sample of sample mean of x, 11. Test the claim that the population means are 64 measurements from a second population with population standard deviation a2 4 had different. Use level of significance 0.01. (a) What distribution does the sample test statistic follow? Explain. The student's t. We assume that both population distributions are approximately...
Most questions answered within 3 hours.
-
Where is the error in this code sequence?
String s1 = "Hello";
String s2 = "ello";...
asked 10 months ago -
Financial data for Joel de Paris, Inc., for last year
follow:
Joel de Paris, Inc.
Balance...
asked 10 months ago -
Consider this reaction:
Al2(SO4)3 (aq)+ BaCl3
(aq) Al2Cl6 (aq)- +
3BaSO4(s) . What is the...
asked 10 months ago -
Suppose that Savneet is considering increasing her
recent random sample from 20 car rentals to 40...
asked 10 months ago -
Trucks arrive at an unloading terminal at an average rate of 120
per hour.
Trucks arrive...
asked 10 months ago -
Why are methanol and ethanol completely soluble in water while
octanol is not very little soluble....
asked 10 months ago -
A facilities manager at a university reads in a research report
that the mean amount of...
asked 10 months ago -
When the CuSO4 is rehydrated by adding water to the anhydrous
compound, is this an endothermic...
asked 10 months ago -
A ray of sunlight is passing from diamond into crown glass; the
angle of incidence is...
asked 10 months ago -
A block of mass 0.249 kg is placed on top of a light, vertical
spring of...
asked 10 months ago -
how do the kidneys compensate in the presences of acidosis
a) trigger hyperventilate
b) reserve acid...
asked 10 months ago -
Question 501 pts
The rental rate of capital to the firm increases. Which of the
following...
asked 10 months ago