
Homework Answers
(a) Increase in demand for final output will increase demand for labor. The labor demand curve will shift rightward to D1, intersecting S at point B, increasing wage rate to W1 and increasing employment to Q1.

(b) The labor saving technological progress will decrease demand for labor. The labor demand curve will shift leftward to D1, intersecting S at point B, decreasing wage rate to W1 and decreasing employment to Q1.

(c) Restriction in immigration into US will decrease labor supply. The labor supply curve will shift leftward to S1, intersecting D at point B, increasing wage rate to W1 and decreasing employment to Q1.

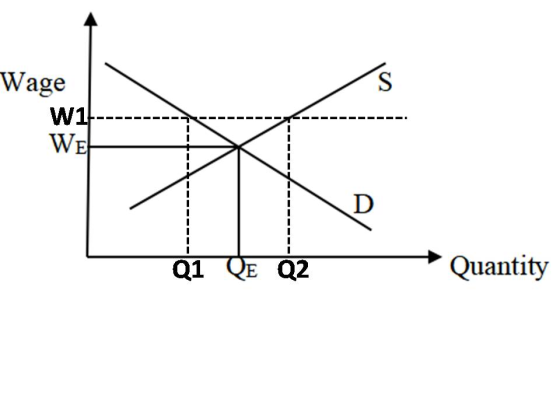
(d) Increase in minimum wage in the state (from WE to W1) will decrease quantity of labor demanded to Q1 but increase quantity of labor supplied to Q2, leading to unemployment of (Q2 - Q1).
(e) Mandatory retirement age will decrease labor supply at any particular time. The labor supply curve will shift leftward to S1, intersecting D at point B, increasing wage rate to W1 and decreasing employment to Q1.
Add Answer to:
Consider the following labor supply and demand curves. For cach of the following situations, show and...
please use print handwriting IF writing on paper! thank you! this all what the teacher gave me Consider the fol...
 please use print handwriting IF writing on paper! thank you!
this all what the teacher gave me
Consider the following labor supply and demand curves. For cach of the following situations, show and explain what would happen to the labor market. The firms who are employing these workers experience a big increase in the demand for their product. Wage w D 0 Quantity b) Intel develops a new computer chip that is capable of doing the same work as two...
please use print handwriting IF writing on paper! thank you!
this all what the teacher gave me
Consider the following labor supply and demand curves. For cach of the following situations, show and explain what would happen to the labor market. The firms who are employing these workers experience a big increase in the demand for their product. Wage w D 0 Quantity b) Intel develops a new computer chip that is capable of doing the same work as two...
Labor and Financial Markets: Reading 4.1: Markets for labor have demand and supply curves, just like...
Labor and Financial Markets: Reading 4.1: Markets for labor have demand and supply curves, just like markets for goods. The law of demand applies in labor markets this way: A higher salary or wage—that is, a higher price in the labor market—leads to a decrease in the quantity of labor demanded by employers, while a lower salary or wage leads to an increase in the quantity of labor demanded. The law of supply functions in labor markets, too: A higher...
Homework (Ch 10) Consider the market for labor depicted by the demand and supply curves that...
 Homework (Ch 10) Consider the market for labor depicted by the demand and supply curves that follow. Use the calculator to help you answer the following questions. You will not be graded on any changes you make to the calculator. Graph Input Tool Market for Labor 20.0 2.50 17.5 Supply Wage (Dollars per hour) Labor Demanded (Thousands of workers) 875 Labor Supplied (Thousands of workers) 15.0 125 12.5 10.0 WAGE (Dollars per hour) 7.5 5.0 Demand 2.5 + 1 0...
Consider the market for labor depicted by the demand and supply curves that follow. Use the...
 Consider the market for labor depicted by the demand and supply curves that follow. Use the calculator to help you answer the following questions. You will not be graded on any changes you make to the calculator. Complete the following table with the quantity of labor supplied and demanded if the wage is set at $15.00. Then indicate whether this wage will result in a shortage or a surplus. Hint: Be sure to pay attention to the units used on the graph and...
The figures below show the supply and demand for labor in the software development industry. The...
 The figures below show the supply and demand for labor in the
software development industry.
The figures below show the supply and demand for labor in the software development industry. Wage ($ thousands) 2001 TTTTT 0 10 20 30 40 50 60 70 80 90 100 110 120 130 140 Software developers (thousands) Instructions: Round your answers to the nearest whole number. a. The equilibrium wage is $C 90 thousand and the equilibrium quantity is 40 thousand workers. In each...
The figures below show the supply and demand for labor in the
software development industry.
The figures below show the supply and demand for labor in the software development industry. Wage ($ thousands) 2001 TTTTT 0 10 20 30 40 50 60 70 80 90 100 110 120 130 140 Software developers (thousands) Instructions: Round your answers to the nearest whole number. a. The equilibrium wage is $C 90 thousand and the equilibrium quantity is 40 thousand workers. In each...
9. Consider the following two demand curves for labor: Qd400- 10*W Qd2 400-20*W a) For each...
 9. Consider the following two demand curves for labor: Qd400- 10*W Qd2 400-20*W a) For each of these, compute the elasticity of demand when the wage is $10 per hour. Answer the following questions for each demand curve If the wage goes up by 10%, what is the percentage change in the quantity demanded. If the wage goes up by 10% what is the change in the number of workers demanded b) d) If the wage goes down by $2...
Problem 1. (Minimum Wage) (20 points): Given the following labor demand and supply curve Ls 10w...
 Problem 1. (Minimum Wage) (20 points): Given the following labor demand and supply curve Ls 10w Lo 80-10w where w is the wage rate, and Ls is quantity of labor suppplied and Lo is quantity demanded for labor. a) Suppose the state government imposes a minimum wage of $5, how many people keep their jobs after the mininmum wage policy is implemented? b) Who are winners and losers in this case? (3 points) c) What is the employers's gain or...
demand and supply Question 7 1 points Save Answer Consider the following labor market Labor demand:...
 demand and supply
Question 7 1 points Save Answer Consider the following labor market Labor demand: LD = ad-w Labor supply: LS = as - 2w where w is the wage, L is the number of workers, ap and as are constants Now suppose that business owners predict low sales next year so they reduce hiring and as a result, ap=70,000 and as=10,000. But in this scenario wages are totally rigid and cannot adjust this year from its original level...
demand and supply
Question 7 1 points Save Answer Consider the following labor market Labor demand: LD = ad-w Labor supply: LS = as - 2w where w is the wage, L is the number of workers, ap and as are constants Now suppose that business owners predict low sales next year so they reduce hiring and as a result, ap=70,000 and as=10,000. But in this scenario wages are totally rigid and cannot adjust this year from its original level...
Consider the following labor market Labor demand: LD = ap - w Labor supply: LS =...
 Consider the following labor market Labor demand: LD = ap - w Labor supply: LS = as + 2w where w is the wage, L is the number of workers, ap and as are constants Now suppose that business owners predict low sales next year so they reduce hiring and as a result, ap=70,000 and ag=10,000. But in this scenario wages are totally rigid and cannot adjust this year from its original level (i.e. when ap=100,000 and ag=10,000): find the...
9. Consider a Classical model with the following specifications in Q1, 2019: . Labor Supply: NS-1%,...
 9. Consider a Classical model with the following specifications in Q1, 2019: . Labor Supply: NS-1%, Cobb-Douglas Production Function . The Quantity Theory of Money accurately describes aggregate demand, The Theory of Distribution holds, Parameter values: [y, a, A, K, M, V] [30,0.3, 130, 500, 2500,40]. Suppose a reduction in labor law regulations leads to an outward shift in labor supply, represented as an increase in y from 30 to 32 during Q2, 2019. Assume that everything else stays the...
 please use print handwriting IF writing on paper! thank you!
this all what the teacher gave me
Consider the following labor supply and demand curves. For cach of the following situations, show and explain what would happen to the labor market. The firms who are employing these workers experience a big increase in the demand for their product. Wage w D 0 Quantity b) Intel develops a new computer chip that is capable of doing the same work as two...
please use print handwriting IF writing on paper! thank you!
this all what the teacher gave me
Consider the following labor supply and demand curves. For cach of the following situations, show and explain what would happen to the labor market. The firms who are employing these workers experience a big increase in the demand for their product. Wage w D 0 Quantity b) Intel develops a new computer chip that is capable of doing the same work as two...
 Homework (Ch 10) Consider the market for labor depicted by the demand and supply curves that follow. Use the calculator to help you answer the following questions. You will not be graded on any changes you make to the calculator. Graph Input Tool Market for Labor 20.0 2.50 17.5 Supply Wage (Dollars per hour) Labor Demanded (Thousands of workers) 875 Labor Supplied (Thousands of workers) 15.0 125 12.5 10.0 WAGE (Dollars per hour) 7.5 5.0 Demand 2.5 + 1 0...
 The figures below show the supply and demand for labor in the
software development industry.
The figures below show the supply and demand for labor in the software development industry. Wage ($ thousands) 2001 TTTTT 0 10 20 30 40 50 60 70 80 90 100 110 120 130 140 Software developers (thousands) Instructions: Round your answers to the nearest whole number. a. The equilibrium wage is $C 90 thousand and the equilibrium quantity is 40 thousand workers. In each...
The figures below show the supply and demand for labor in the
software development industry.
The figures below show the supply and demand for labor in the software development industry. Wage ($ thousands) 2001 TTTTT 0 10 20 30 40 50 60 70 80 90 100 110 120 130 140 Software developers (thousands) Instructions: Round your answers to the nearest whole number. a. The equilibrium wage is $C 90 thousand and the equilibrium quantity is 40 thousand workers. In each...
 9. Consider the following two demand curves for labor: Qd400- 10*W Qd2 400-20*W a) For each of these, compute the elasticity of demand when the wage is $10 per hour. Answer the following questions for each demand curve If the wage goes up by 10%, what is the percentage change in the quantity demanded. If the wage goes up by 10% what is the change in the number of workers demanded b) d) If the wage goes down by $2...
 Problem 1. (Minimum Wage) (20 points): Given the following labor demand and supply curve Ls 10w Lo 80-10w where w is the wage rate, and Ls is quantity of labor suppplied and Lo is quantity demanded for labor. a) Suppose the state government imposes a minimum wage of $5, how many people keep their jobs after the mininmum wage policy is implemented? b) Who are winners and losers in this case? (3 points) c) What is the employers's gain or...
 demand and supply
Question 7 1 points Save Answer Consider the following labor market Labor demand: LD = ad-w Labor supply: LS = as - 2w where w is the wage, L is the number of workers, ap and as are constants Now suppose that business owners predict low sales next year so they reduce hiring and as a result, ap=70,000 and as=10,000. But in this scenario wages are totally rigid and cannot adjust this year from its original level...
demand and supply
Question 7 1 points Save Answer Consider the following labor market Labor demand: LD = ad-w Labor supply: LS = as - 2w where w is the wage, L is the number of workers, ap and as are constants Now suppose that business owners predict low sales next year so they reduce hiring and as a result, ap=70,000 and as=10,000. But in this scenario wages are totally rigid and cannot adjust this year from its original level...
 Consider the following labor market Labor demand: LD = ap - w Labor supply: LS = as + 2w where w is the wage, L is the number of workers, ap and as are constants Now suppose that business owners predict low sales next year so they reduce hiring and as a result, ap=70,000 and ag=10,000. But in this scenario wages are totally rigid and cannot adjust this year from its original level (i.e. when ap=100,000 and ag=10,000): find the...
 9. Consider a Classical model with the following specifications in Q1, 2019: . Labor Supply: NS-1%, Cobb-Douglas Production Function . The Quantity Theory of Money accurately describes aggregate demand, The Theory of Distribution holds, Parameter values: [y, a, A, K, M, V] [30,0.3, 130, 500, 2500,40]. Suppose a reduction in labor law regulations leads to an outward shift in labor supply, represented as an increase in y from 30 to 32 during Q2, 2019. Assume that everything else stays the...
Most questions answered within 3 hours.
-
Where is the error in this code sequence?
String s1 = "Hello";
String s2 = "ello";...
asked 10 months ago -
Financial data for Joel de Paris, Inc., for last year
follow:
Joel de Paris, Inc.
Balance...
asked 10 months ago -
Consider this reaction:
Al2(SO4)3 (aq)+ BaCl3
(aq) Al2Cl6 (aq)- +
3BaSO4(s) . What is the...
asked 10 months ago -
Suppose that Savneet is considering increasing her
recent random sample from 20 car rentals to 40...
asked 10 months ago -
Trucks arrive at an unloading terminal at an average rate of 120
per hour.
Trucks arrive...
asked 10 months ago -
Why are methanol and ethanol completely soluble in water while
octanol is not very little soluble....
asked 10 months ago -
A facilities manager at a university reads in a research report
that the mean amount of...
asked 10 months ago -
When the CuSO4 is rehydrated by adding water to the anhydrous
compound, is this an endothermic...
asked 10 months ago -
A ray of sunlight is passing from diamond into crown glass; the
angle of incidence is...
asked 10 months ago -
A block of mass 0.249 kg is placed on top of a light, vertical
spring of...
asked 10 months ago -
how do the kidneys compensate in the presences of acidosis
a) trigger hyperventilate
b) reserve acid...
asked 10 months ago -
Question 501 pts
The rental rate of capital to the firm increases. Which of the
following...
asked 10 months ago