
Homework Answers

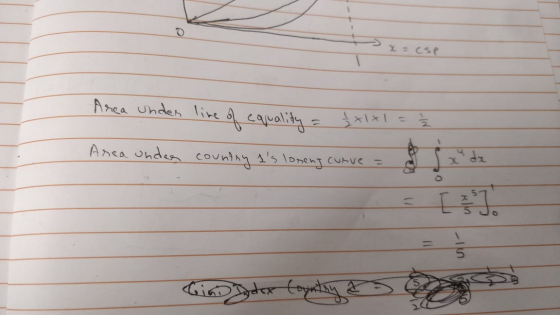

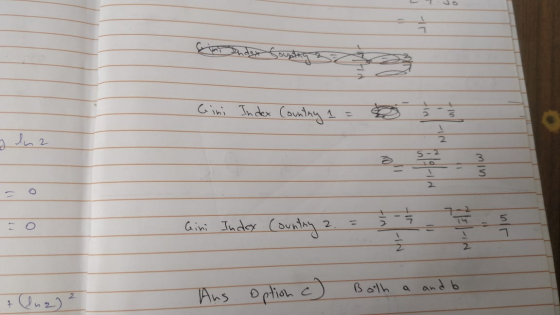
Gini Index = (Area between line of equality and the country's lorenz curve) divided by area under line of equality
Add Answer to:
• Consider the following Lorenz curves for two countries. Country 1: cis = cip4 Country 2:...
The figure shows Lorenz curves before and after automation (the solid and dashed line, respectively). Prior...
 The figure shows Lorenz curves before and after automation (the
solid and dashed line, respectively). Prior to automation there are
90 workers who receive a total of 60% of the economy’s income. Of
these 90 workers, 60 have skills which are substitutes for those of
the new robots, while 30 have skills which are complementary to the
robots. There are 5 owners who earn 40% of the economy’s income,
and 5 workers who are unemployed. The total income of the...
The figure shows Lorenz curves before and after automation (the
solid and dashed line, respectively). Prior to automation there are
90 workers who receive a total of 60% of the economy’s income. Of
these 90 workers, 60 have skills which are substitutes for those of
the new robots, while 30 have skills which are complementary to the
robots. There are 5 owners who earn 40% of the economy’s income,
and 5 workers who are unemployed. The total income of the...
Lorenz Curve The United Nations reports data on income distribution for different countries as a ratio...
Lorenz Curve The United Nations reports data on income distribution for different countries as a ratio of the income of the richest 10% to the income of the poorest 10%. If the ratio for Japan is 4.5 and the ratio for the United States is 15.9, which of the following statements is correct? a) This ratio is the slope of the Lorenz curve for each country. b) This is the same thing as the Gini coefficient. c) The distribution of...
I need help with this question please! - 4 marks) In economics, a population's Lorenz curve...
 I need help with this question
please!
- 4 marks) In economics, a population's Lorenz curve L(2) gives the percentage (as a decimal) of the country's distribution of wealth among the lowest earning percentage 2 (as a decimal between 0 and 1; e.g., 35% means x = 0.35) of the population. As an example, if L(0.4) = 0.1, then this means that the lowest earning 40% of households have only 10% of the entire economy's wealth. The line y =...
I need help with this question
please!
- 4 marks) In economics, a population's Lorenz curve L(2) gives the percentage (as a decimal) of the country's distribution of wealth among the lowest earning percentage 2 (as a decimal between 0 and 1; e.g., 35% means x = 0.35) of the population. As an example, if L(0.4) = 0.1, then this means that the lowest earning 40% of households have only 10% of the entire economy's wealth. The line y =...
1) Figure 2 below is an image of a Lorenz curve. a. (4) When the Lorenz...
 1) Figure 2 below is an image of a Lorenz curve. a. (4) When the Lorenz curve sags lower, does that mean the economy is more equal or more unequal? b. (6) Explain how to use the information in Figure 2 to calculate the Gini coefficient 1. What is the typical range for Gini coefficients? ii. What does a high number indicate? 100 Perfect Equality Line Percentage of income Lorenz Curve 100 Percentage of Population Figure 2 2) (10) Describe...
1) Figure 2 below is an image of a Lorenz curve. a. (4) When the Lorenz...
 1) Figure 2 below is an image of a Lorenz curve. a. (4) When the Lorenz curve sags lower, does that mean the economy is more equal or more unequal? b. (6) Explain how to use the information in Figure 2 to calculate the Gini coefficient. i. What is the typical range for Gini coefficients? ii. What does a high number indicate? 100 Perfect Equality Line Percentage of Income Lorenz Curve 100 Percentage of Population Figure 2 2) (10) Describe...
1) Figure 2 below is an image of a Lorenz curve. a. (4) When the Lorenz...
 1) Figure 2 below is an image of a Lorenz curve. a. (4) When the Lorenz curve sags lower, does that mean the economy is more equal or more unequal? I i. What does a high number indicate? b. (Explain how to use the information in Figure 2 to calculate the Gini coefficient. i. What is the typical range for Gini coefficients? ii. What does a high number indicate? 100 Perfect Equality Line Percentage of Income Lorenz Curve 0 100...
Consider the world with two countries: Country A and Country B. There are two states of...
Consider the world with two countries: Country A and Country B. There are two states of the world: State 1 and State 2, and the probability of realization of each state is 50%. In State 1, output of Country A is $100 billion, and output of Country B is $80 billion. In State 2, output of Country A is $90 billion, and output of Country B is $120 billion. Assume that the share of labor income in output is 60%...
Country A has a Gini coefficient of .8 (point 8), and country B has a Gini...
Country A has a Gini coefficient of .8 (point 8), and country B has a Gini coefficient of .2 (point 2). Which of the following can we conclude? Country B has more income inequality than country A. If you add the incomes of the populations of country A and country B, you will end up with a perfectly equal income distribution. All of the listed answers are correct. Both countries have relatively equal income distributions. Both countries have equal income...
Problem 4 Economic Inequality (20 points) 1) Figure 2 below is an image of a Lorenz...
 Problem 4 Economic Inequality (20 points) 1) Figure 2 below is an image of a Lorenz curve. a. (4) When the Lorenz curve sags lower, does that mean the economy is more equal or more unequal? b. (6) Explain how to use the information in Figure 2 to calculate the Gini coefficient. i. What is the typical range for Gini coefficients? ii. What does a high number indicate? 100 Perfect Equality Line Percentage of Income Lorenz Curve Percentage of Population...
• Exercise 2 Consider the following Phillips curves for country A and B (assuming that the...
 • Exercise 2 Consider the following Phillips curves for country A and B (assuming that the = 7+-1): - (2) T = 1 + (m4 +24) – aux TB = R1 + (mB + zB) - au (3) where a is the inflation rate, m is the markup, z includes institutional characteristics , Ut is the effective unemployment rate and a is a parameter which describes the magnitude of the impact of unemployment on real wages. 1. Assume that a...
 The figure shows Lorenz curves before and after automation (the
solid and dashed line, respectively). Prior to automation there are
90 workers who receive a total of 60% of the economy’s income. Of
these 90 workers, 60 have skills which are substitutes for those of
the new robots, while 30 have skills which are complementary to the
robots. There are 5 owners who earn 40% of the economy’s income,
and 5 workers who are unemployed. The total income of the...
The figure shows Lorenz curves before and after automation (the
solid and dashed line, respectively). Prior to automation there are
90 workers who receive a total of 60% of the economy’s income. Of
these 90 workers, 60 have skills which are substitutes for those of
the new robots, while 30 have skills which are complementary to the
robots. There are 5 owners who earn 40% of the economy’s income,
and 5 workers who are unemployed. The total income of the...
 I need help with this question
please!
- 4 marks) In economics, a population's Lorenz curve L(2) gives the percentage (as a decimal) of the country's distribution of wealth among the lowest earning percentage 2 (as a decimal between 0 and 1; e.g., 35% means x = 0.35) of the population. As an example, if L(0.4) = 0.1, then this means that the lowest earning 40% of households have only 10% of the entire economy's wealth. The line y =...
I need help with this question
please!
- 4 marks) In economics, a population's Lorenz curve L(2) gives the percentage (as a decimal) of the country's distribution of wealth among the lowest earning percentage 2 (as a decimal between 0 and 1; e.g., 35% means x = 0.35) of the population. As an example, if L(0.4) = 0.1, then this means that the lowest earning 40% of households have only 10% of the entire economy's wealth. The line y =...
 1) Figure 2 below is an image of a Lorenz curve. a. (4) When the Lorenz curve sags lower, does that mean the economy is more equal or more unequal? b. (6) Explain how to use the information in Figure 2 to calculate the Gini coefficient 1. What is the typical range for Gini coefficients? ii. What does a high number indicate? 100 Perfect Equality Line Percentage of income Lorenz Curve 100 Percentage of Population Figure 2 2) (10) Describe...
 1) Figure 2 below is an image of a Lorenz curve. a. (4) When the Lorenz curve sags lower, does that mean the economy is more equal or more unequal? b. (6) Explain how to use the information in Figure 2 to calculate the Gini coefficient. i. What is the typical range for Gini coefficients? ii. What does a high number indicate? 100 Perfect Equality Line Percentage of Income Lorenz Curve 100 Percentage of Population Figure 2 2) (10) Describe...
 1) Figure 2 below is an image of a Lorenz curve. a. (4) When the Lorenz curve sags lower, does that mean the economy is more equal or more unequal? I i. What does a high number indicate? b. (Explain how to use the information in Figure 2 to calculate the Gini coefficient. i. What is the typical range for Gini coefficients? ii. What does a high number indicate? 100 Perfect Equality Line Percentage of Income Lorenz Curve 0 100...
 Problem 4 Economic Inequality (20 points) 1) Figure 2 below is an image of a Lorenz curve. a. (4) When the Lorenz curve sags lower, does that mean the economy is more equal or more unequal? b. (6) Explain how to use the information in Figure 2 to calculate the Gini coefficient. i. What is the typical range for Gini coefficients? ii. What does a high number indicate? 100 Perfect Equality Line Percentage of Income Lorenz Curve Percentage of Population...
 • Exercise 2 Consider the following Phillips curves for country A and B (assuming that the = 7+-1): - (2) T = 1 + (m4 +24) – aux TB = R1 + (mB + zB) - au (3) where a is the inflation rate, m is the markup, z includes institutional characteristics , Ut is the effective unemployment rate and a is a parameter which describes the magnitude of the impact of unemployment on real wages. 1. Assume that a...
Most questions answered within 3 hours.
-
Where is the error in this code sequence?
String s1 = "Hello";
String s2 = "ello";...
asked 10 months ago -
Financial data for Joel de Paris, Inc., for last year
follow:
Joel de Paris, Inc.
Balance...
asked 10 months ago -
Consider this reaction:
Al2(SO4)3 (aq)+ BaCl3
(aq) Al2Cl6 (aq)- +
3BaSO4(s) . What is the...
asked 10 months ago -
Suppose that Savneet is considering increasing her
recent random sample from 20 car rentals to 40...
asked 10 months ago -
Trucks arrive at an unloading terminal at an average rate of 120
per hour.
Trucks arrive...
asked 10 months ago -
Why are methanol and ethanol completely soluble in water while
octanol is not very little soluble....
asked 10 months ago -
A facilities manager at a university reads in a research report
that the mean amount of...
asked 10 months ago -
When the CuSO4 is rehydrated by adding water to the anhydrous
compound, is this an endothermic...
asked 10 months ago -
A ray of sunlight is passing from diamond into crown glass; the
angle of incidence is...
asked 10 months ago -
A block of mass 0.249 kg is placed on top of a light, vertical
spring of...
asked 10 months ago -
how do the kidneys compensate in the presences of acidosis
a) trigger hyperventilate
b) reserve acid...
asked 10 months ago -
Question 501 pts
The rental rate of capital to the firm increases. Which of the
following...
asked 10 months ago