

Homework Answers
Part (a)
 E
is the equilibrium point.
E
is the equilibrium point.
Part (b)
Please read the graph on both the axes.
At equilibrium, price = $ 4 and Quantity demanded = Quantity Supplied = 8,000
Part (c)
The green line shows the line corresponding to price = $ 5.

At this price, the demand is given by point D while supply is given by point S. Quantity supplied > Quantity demanded. This is a situation of over supply. Because of over supply, the prices will decrease. Reduction in price will lead to lower supply. So, the point S will slide down the supply line (orange line). As prices decrease the demand will go up. So, the point D will rise up the demand curve (blue line). Eventually both the points will meet at equilibrium E, where quantity demanded will be same as quantity supplied at a price of $ 4. Hence, the situation will converge to the equilibrium point.
Part (d)
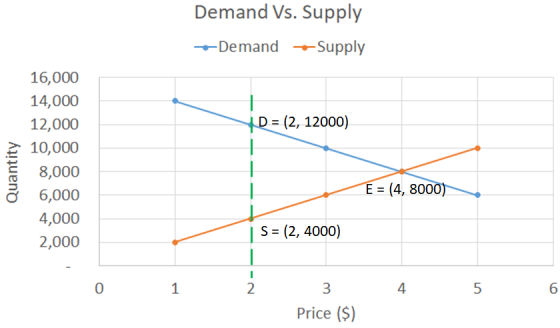
At this price, the demand is given by point D while supply is given by point S. Quantity supplied < Quantity demanded. This is a situation of under supply. Because of under supply, the prices will increase. Increase in price will lead to increase in supply. So, the point S will slide up the supply line (orange line). As prices increases the demand will go down. So, the point D will slide down the demand curve (blue line). Eventually both the points will meet at equilibrium E, where quantity demanded will be same as quantity supplied at a price of $ 4. Hence, the situation will converge to the equilibrium point.
Add Answer to:
a. Given the table below, graph the demand and supply curves for flashlights. Make certain to...
1. Review on demand and supply of flashlights 1) Given the table below, graph the demand...
 1. Review on demand and supply of flashlights 1) Given the table below, graph the demand and supply curves for flashlights. Make certain to label the equilibrium price and equilibrium quantity Price Quantity Demanded Quantity Supplied $5 $4 $3 $2 $1 Per Month 6,000 8,000 10,000 12,000 14,000 Per Month 10,000 8,000 6,000 4,000 2,000 2) What is the equilibrium price and the equilibrium quantity? 3) Suppose the price is currently $5. What problem would exist in the market? What...
Problem 2 Answer the following questions based on the table below. PriceQuantity Quantity Supplied Per Month...
 Problem 2 Answer the following questions based on the table below. PriceQuantity Quantity Supplied Per Month S5 $4 $3 $2 Demanded Per Month 6,000 8,000 10,000 12,000 10,000 8,000 6,000 4,000 $1 14,0002,000 Given the table above, graph the demand and supply curves for flashlights. Make certain to label the equilibrium price and equilibrium quantity. What is the equilibrium price and the equilibrium quantity? Suppose the price is currently S5. What problem would exist in the market? What would you...
The demand and supply for automoblles In a certain country is given In the graph below....
 The demand and supply for automoblles In a certain country is given In the graph below. The world price of automobles is $8,000. a. Assuming that the economy Is closed, find the equilibrium price and quantity of automobles. Instructions: Indicate the equilibrium price and quantity using the tool "Equilibrium* by clicking on the appropriate Intercept on the given graph. Market for Cars Price of cars (S) 26,000 24,000 22,000 20,000 18,000 16,000 14,000 12,000 10,000 8,000 6,000 4,000 2,000 Tools...
The following graph shows the monthly demand and supply curves in the market for calendars.
 12. Market equilibrium and disequilibrium The following graph shows the monthly demand and supply curves in the market for calendars. Use the graph input tool to help you answer the following questions. Enter an amount into the Price field to see the quantity demanded and quantity supplied at that price. You will not be graded on any changes you make to this graph. The equilibrium price in this market is _______ per calendar, and the equilibrium quantity is _______ calendars bought and sold...
The following graph shows the monthly demand and supply curves in the market for hats.
 12. Market equilibrium and disequilibrium The following graph shows the monthly demand and supply curves in the market for hats. Use the graph input tool to help you answer the following questions. Enter an amount into the Price field to see the quantity demanded and quantity supplied at that price. You will not be graded on any changes you make to this graph. The equilibrium price in this market is _______ per hat, and the equilibrium quantity is _______ hats bought and sold...
1. We are examining the market for gold picture frames in Ontario. Given below are the demand schedule and supply schedule for this product for one year. Accurately graph the demand and supply curves on one graph and determine equilibrium in this marke
1. We are examining the market for gold picture frames in Ontario. Given below are the demand schedule and supply schedule for this product for one year. Accurately graph the demand and supply curves on one graph and determine equilibrium in this market. Label the graph and axises properly. State where equilibrium is (both price and quantity), don’t just point to it on the graph. Make sure you have the price and quantity demanded on the correct axis. (5 marks – 4...
The market for iced tea is characterized by the following supply and demand functions: Supply: Qs=50+8p Demand: QD=120...
 The market for iced tea is characterized by the following supply
and demand functions:
Supply: Qs=50+8p
Demand: QD=120−6p ,
where Qs stands for quantity supplied (number of
bottles), QD stands for quantity demanded (number of
bottles), and p stands for price (per bottle). Suppose that the
current price per bottle in the market for iced tea is $6.
A) At the price of $6 per bottle in the market for iced tea,
sellers would want to sell bottles.
B) At the...
The market for iced tea is characterized by the following supply
and demand functions:
Supply: Qs=50+8p
Demand: QD=120−6p ,
where Qs stands for quantity supplied (number of
bottles), QD stands for quantity demanded (number of
bottles), and p stands for price (per bottle). Suppose that the
current price per bottle in the market for iced tea is $6.
A) At the price of $6 per bottle in the market for iced tea,
sellers would want to sell bottles.
B) At the...
E) Solve the mathematical problems below: 1. The demand and supply curves for hotdogs in California...
 E) Solve the mathematical problems below: 1. The demand and supply curves for hotdogs in California are given by the following two equations QD = 8,000 - 800P QS = 2,000 + 200P Where QD represents quantity demanded, QS represents quantity supplied and P represents price. a. Find the equilibrium quantity and price: b. If students suddenly acquire a greater taste for hotdogs, which of the following would be the new demand curve? Circle the correct equation: QD = 6,500...
Suppose the demand and supply curves for eggs in the United States are given by the...
 Suppose the demand and supply curves for eggs in the United States are given by the following equations: Qi = 100 – 20P Q. = 10 + 40P where Qd = millions of dozens of eggs Americans would like to buy each year; Q = millions of dozens of eggs U.S. farms would like to sell each year; and P = price per dozen eggs. a. Fill in the following table: Price (Per Dozen) Quantity Demanded (Q) Quantity Supplied (2.)...
The supply and demand curves for a product are as follows: ?? = 5,000...
The supply and demand curves for a product are as follows: ?? = 5,000 + 10,000? ?? = 30,000 − 15,000? where, Qs is the quantity supplied (in tons) and Qd is the quantity demanded (in tons) and P is the price per ton (hundreds of dollars per ton). a) What is the equilibrium price? b) What is the equilibrium quantity?
 1. Review on demand and supply of flashlights 1) Given the table below, graph the demand and supply curves for flashlights. Make certain to label the equilibrium price and equilibrium quantity Price Quantity Demanded Quantity Supplied $5 $4 $3 $2 $1 Per Month 6,000 8,000 10,000 12,000 14,000 Per Month 10,000 8,000 6,000 4,000 2,000 2) What is the equilibrium price and the equilibrium quantity? 3) Suppose the price is currently $5. What problem would exist in the market? What...
 Problem 2 Answer the following questions based on the table below. PriceQuantity Quantity Supplied Per Month S5 $4 $3 $2 Demanded Per Month 6,000 8,000 10,000 12,000 10,000 8,000 6,000 4,000 $1 14,0002,000 Given the table above, graph the demand and supply curves for flashlights. Make certain to label the equilibrium price and equilibrium quantity. What is the equilibrium price and the equilibrium quantity? Suppose the price is currently S5. What problem would exist in the market? What would you...
 The demand and supply for automoblles In a certain country is given In the graph below. The world price of automobles is $8,000. a. Assuming that the economy Is closed, find the equilibrium price and quantity of automobles. Instructions: Indicate the equilibrium price and quantity using the tool "Equilibrium* by clicking on the appropriate Intercept on the given graph. Market for Cars Price of cars (S) 26,000 24,000 22,000 20,000 18,000 16,000 14,000 12,000 10,000 8,000 6,000 4,000 2,000 Tools...
 The market for iced tea is characterized by the following supply
and demand functions:
Supply: Qs=50+8p
Demand: QD=120−6p ,
where Qs stands for quantity supplied (number of
bottles), QD stands for quantity demanded (number of
bottles), and p stands for price (per bottle). Suppose that the
current price per bottle in the market for iced tea is $6.
A) At the price of $6 per bottle in the market for iced tea,
sellers would want to sell bottles.
B) At the...
The market for iced tea is characterized by the following supply
and demand functions:
Supply: Qs=50+8p
Demand: QD=120−6p ,
where Qs stands for quantity supplied (number of
bottles), QD stands for quantity demanded (number of
bottles), and p stands for price (per bottle). Suppose that the
current price per bottle in the market for iced tea is $6.
A) At the price of $6 per bottle in the market for iced tea,
sellers would want to sell bottles.
B) At the...
 E) Solve the mathematical problems below: 1. The demand and supply curves for hotdogs in California are given by the following two equations QD = 8,000 - 800P QS = 2,000 + 200P Where QD represents quantity demanded, QS represents quantity supplied and P represents price. a. Find the equilibrium quantity and price: b. If students suddenly acquire a greater taste for hotdogs, which of the following would be the new demand curve? Circle the correct equation: QD = 6,500...
 Suppose the demand and supply curves for eggs in the United States are given by the following equations: Qi = 100 – 20P Q. = 10 + 40P where Qd = millions of dozens of eggs Americans would like to buy each year; Q = millions of dozens of eggs U.S. farms would like to sell each year; and P = price per dozen eggs. a. Fill in the following table: Price (Per Dozen) Quantity Demanded (Q) Quantity Supplied (2.)...
Most questions answered within 3 hours.
-
Where is the error in this code sequence?
String s1 = "Hello";
String s2 = "ello";...
asked 10 months ago -
Financial data for Joel de Paris, Inc., for last year
follow:
Joel de Paris, Inc.
Balance...
asked 10 months ago -
Consider this reaction:
Al2(SO4)3 (aq)+ BaCl3
(aq) Al2Cl6 (aq)- +
3BaSO4(s) . What is the...
asked 10 months ago -
Suppose that Savneet is considering increasing her
recent random sample from 20 car rentals to 40...
asked 10 months ago -
Trucks arrive at an unloading terminal at an average rate of 120
per hour.
Trucks arrive...
asked 10 months ago -
Why are methanol and ethanol completely soluble in water while
octanol is not very little soluble....
asked 10 months ago -
A facilities manager at a university reads in a research report
that the mean amount of...
asked 10 months ago -
When the CuSO4 is rehydrated by adding water to the anhydrous
compound, is this an endothermic...
asked 10 months ago -
A ray of sunlight is passing from diamond into crown glass; the
angle of incidence is...
asked 10 months ago -
A block of mass 0.249 kg is placed on top of a light, vertical
spring of...
asked 10 months ago -
how do the kidneys compensate in the presences of acidosis
a) trigger hyperventilate
b) reserve acid...
asked 10 months ago -
Question 501 pts
The rental rate of capital to the firm increases. Which of the
following...
asked 10 months ago