


Homework Answers
Add Answer to:
Common-Sized Income Statement Revenue and expense data for the current calendar year for Tannenhill Company and...
Common-Sized Income Statement Revenue and expense data for the current calendar year for Tannenhill Company and...
Common-Sized Income Statement Revenue and expense data for the current calendar year for Tannenhill Company and for the electronics industry are as follows. Tannenhill’s data are expressed in dollars. The electronics industry averages are expressed in percentages. Tannenhill Company Electronics Industry Average Sales $1,010,000 100 % Cost of goods sold 545,400 60 Gross profit $464,600 40 % Selling expenses $292,900 24 % Administrative expenses 111,100 10 Total operating expenses $404,000 34 % Operating income $60,600 6 % Other revenue 20,200...
Common-Sized Income Statement Revenue and expense data for the current calendar year for Tannenhill Company and...
Common-Sized Income Statement Revenue and expense data for the current calendar year for Tannenhill Company and for the electronics industry are as follows. Tannenhill’s data are expressed in dollars. The electronics industry averages are expressed in percentages. Tannenhill Company Electronics Industry Average Sales $770,000 100 % Cost of goods sold 415,800 59 Gross profit $354,200 41 % Selling expenses $223,300 25 % Administrative expenses 84,700 10 Total operating expenses $308,000 35 % Operating income $46,200 6 % Other income 15,400...
Revenue and expense data for the current calendar year for Tannenhill Company and for the electronics...
Revenue and expense data for the current calendar year for Tannenhill Company and for the electronics industry are as follows. Tannenhill’s data are expressed in dollars. The electronics industry averages are expressed in percentages. Tannenhill Company Electronics Industry Average Sales $1,740,000 100 % Cost of goods sold 1,078,800 68 Gross profit $661,200 32 % Selling expenses $400,200 18 % Administrative expenses 156,600 8 Total operating expenses $556,800 26 % Operating income $104,400 6 % Other revenue 34,800 2 $139,200 8...
Show Me How Calculator Common-Sized Income Statement Revenue and expense data for the current calendar year...
 Show Me How Calculator Common-Sized Income Statement Revenue and expense data for the current calendar year for Tannenhill Company and for the electronics industry are as follows. Tannenhill's data are expressed in dollars. The electronics industry averages are expressed in percentages. Tannenhill Company Electronics Industry Average Sales 100.0 % 60.0 40.0 % 24.0 % Cost of goods sold Gross profit Selling expenses Administrative expenses Total operating expenses Operating income Other revenue $4,000,000 2,120,000 $1,680,000 $1,080,000 640,000 $1,720,000 $160,000 120,000 14.0...
Common-Sized Income Statement Revenue and expense data for the current calendar year for Sorenson Electronics Company...
Common-Sized Income Statement Revenue and expense data for the current calendar year for Sorenson Electronics Company and for the electronics industry are as follows. Sorenson Electronics Company data are expressed in dollars. The electronics industry averages are expressed in percentages. Sorenson Electronics Company Electronics Industry Average Sales $2,360,000 100 % Cost of goods sold (1,298,000) (61) Gross profit $1,062,000 39 % Selling expenses $(637,200) (17) % Administrative expenses (259,600) (16) Total operating expenses $(896,800) (33) % Operating income $165,200 6...
Revenue and expense data for the current calendar year for Tannenhill Company and for the electronics...
Revenue and expense data for the current calendar year for Tannenhill Company and for the electronics industry are as follows. The Tannenhill’s data are expressed in dollars. The electronics industry averages are expressed in percentages. 1 Tannenhill Company Electronics Industry Average 2 Sales $4,000,000.00 100.0% 3 Cost of goods sold 2,120,000.00 60.0 4 Gross profit $1,880,000.00 40.0% 5 Selling expenses $1,080,000.00 24.0% 6 Administrative expenses 640,000.00 14.0 7 Total operating expenses $1,720,000.00 38.0% 8 Operating income $160,000.00 2.0% 9 Other...
Show Me How Calculator Common-Sized Income Statement Revenue and expense data for the current calendar year for Ta...
 Show Me How Calculator Common-Sized Income Statement Revenue and expense data for the current calendar year for Tannenhill Company and for the electronics industry are as follows. Tannenhill's data are expressed in dollars. The electronics industry averages are expressed in percentages. Tannenhill Company Electronics Industry Average Sales 100.0 % 60.0 40.0 % 24.0 % Cost of goods sold Gross profit Selling expenses Administrative expenses Total operating expenses Operating income Other revenue $4,000,000 2,120,000 $1,680,000 $1,080,000 640,000 $1,720,000 $160,000 120,000 14.0...
Instructions Revenue and expense data for the current calendar year for Tannenhill Company and for the electronics indus...
Instructions Revenue and expense data for the current calendar year for Tannenhill Company and for the electronics industry are as follows. The Tannenhill’s data are expressed in dollars. The electronics industry averages are expressed in percentages. 1 Tannenhill Company Electronics Industry Average 2 Sales $4,920,000.00 100.0% 3 Cost of goods sold 2,533,800.00 56.5 4 Gross profit $2,386,200.00 43.5% 5 Selling expenses $1,328,400.00 24.0% 6 Administrative expenses 787,200.00 14.0 7 Total operating expenses $2,115,600.00 38.0% 8 Operating income $270,600.00 5.5% 9...
question#2 SHOW Me How Calculator Revenue and expense data for the current calendar year for Tannenhill...
 question#2
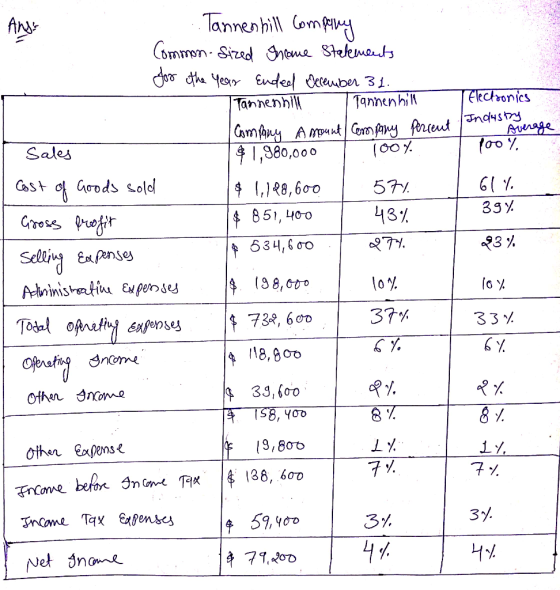
SHOW Me How Calculator Revenue and expense data for the current calendar year for Tannenhill Company and for the electronics Industry are as follows. Tannenhill's data are expressed in dollars. The electronics Industry averages are expressed in percentages. - Tannenhill Company Electronics Industry Average Sales 100 % Cost of goods sold Gross profit 26 % Selling expenses 14 % $1,870,000 1,290,300 $579,700 $336,600 130,900 $467,500 $112,200 37,400 Administrative expenses Total operating expenses Operating income Other income $149,600 Other expense...
question#2
SHOW Me How Calculator Revenue and expense data for the current calendar year for Tannenhill Company and for the electronics Industry are as follows. Tannenhill's data are expressed in dollars. The electronics Industry averages are expressed in percentages. - Tannenhill Company Electronics Industry Average Sales 100 % Cost of goods sold Gross profit 26 % Selling expenses 14 % $1,870,000 1,290,300 $579,700 $336,600 130,900 $467,500 $112,200 37,400 Administrative expenses Total operating expenses Operating income Other income $149,600 Other expense...
Common-Sized Income Statement Revenue and expense data for the current calendar year for Sorenson Electronics Company...
 Common-Sized Income Statement Revenue and expense data for the current calendar year for Sorenson Electronics Company and for the electronics industry are as follows. The Sorenson Electronics Company data are expressed in dollars. The electronics industry averages are expressed in percentages. Sorenson Electronics Company Electronics Industry Average 101.9 % $1,834,200 34,200 1.9 Sales Sales returns and allowances Net sales Cost of goods sold 100 % $1,800,000 1,098,000 $702,000 Gross profit 34 % 20 % Selling expenses $432,000 Administrative expenses 162,000...
 Show Me How Calculator Common-Sized Income Statement Revenue and expense data for the current calendar year for Tannenhill Company and for the electronics industry are as follows. Tannenhill's data are expressed in dollars. The electronics industry averages are expressed in percentages. Tannenhill Company Electronics Industry Average Sales 100.0 % 60.0 40.0 % 24.0 % Cost of goods sold Gross profit Selling expenses Administrative expenses Total operating expenses Operating income Other revenue $4,000,000 2,120,000 $1,680,000 $1,080,000 640,000 $1,720,000 $160,000 120,000 14.0...
 Show Me How Calculator Common-Sized Income Statement Revenue and expense data for the current calendar year for Tannenhill Company and for the electronics industry are as follows. Tannenhill's data are expressed in dollars. The electronics industry averages are expressed in percentages. Tannenhill Company Electronics Industry Average Sales 100.0 % 60.0 40.0 % 24.0 % Cost of goods sold Gross profit Selling expenses Administrative expenses Total operating expenses Operating income Other revenue $4,000,000 2,120,000 $1,680,000 $1,080,000 640,000 $1,720,000 $160,000 120,000 14.0...
 question#2
SHOW Me How Calculator Revenue and expense data for the current calendar year for Tannenhill Company and for the electronics Industry are as follows. Tannenhill's data are expressed in dollars. The electronics Industry averages are expressed in percentages. - Tannenhill Company Electronics Industry Average Sales 100 % Cost of goods sold Gross profit 26 % Selling expenses 14 % $1,870,000 1,290,300 $579,700 $336,600 130,900 $467,500 $112,200 37,400 Administrative expenses Total operating expenses Operating income Other income $149,600 Other expense...
question#2
SHOW Me How Calculator Revenue and expense data for the current calendar year for Tannenhill Company and for the electronics Industry are as follows. Tannenhill's data are expressed in dollars. The electronics Industry averages are expressed in percentages. - Tannenhill Company Electronics Industry Average Sales 100 % Cost of goods sold Gross profit 26 % Selling expenses 14 % $1,870,000 1,290,300 $579,700 $336,600 130,900 $467,500 $112,200 37,400 Administrative expenses Total operating expenses Operating income Other income $149,600 Other expense...
 Common-Sized Income Statement Revenue and expense data for the current calendar year for Sorenson Electronics Company and for the electronics industry are as follows. The Sorenson Electronics Company data are expressed in dollars. The electronics industry averages are expressed in percentages. Sorenson Electronics Company Electronics Industry Average 101.9 % $1,834,200 34,200 1.9 Sales Sales returns and allowances Net sales Cost of goods sold 100 % $1,800,000 1,098,000 $702,000 Gross profit 34 % 20 % Selling expenses $432,000 Administrative expenses 162,000...
Most questions answered within 3 hours.
-
Where is the error in this code sequence?
String s1 = "Hello";
String s2 = "ello";...
asked 10 months ago -
Financial data for Joel de Paris, Inc., for last year
follow:
Joel de Paris, Inc.
Balance...
asked 10 months ago -
Consider this reaction:
Al2(SO4)3 (aq)+ BaCl3
(aq) Al2Cl6 (aq)- +
3BaSO4(s) . What is the...
asked 10 months ago -
Suppose that Savneet is considering increasing her
recent random sample from 20 car rentals to 40...
asked 10 months ago -
Trucks arrive at an unloading terminal at an average rate of 120
per hour.
Trucks arrive...
asked 10 months ago -
Why are methanol and ethanol completely soluble in water while
octanol is not very little soluble....
asked 10 months ago -
A facilities manager at a university reads in a research report
that the mean amount of...
asked 10 months ago -
When the CuSO4 is rehydrated by adding water to the anhydrous
compound, is this an endothermic...
asked 10 months ago -
A ray of sunlight is passing from diamond into crown glass; the
angle of incidence is...
asked 10 months ago -
A block of mass 0.249 kg is placed on top of a light, vertical
spring of...
asked 10 months ago -
how do the kidneys compensate in the presences of acidosis
a) trigger hyperventilate
b) reserve acid...
asked 10 months ago -
Question 501 pts
The rental rate of capital to the firm increases. Which of the
following...
asked 10 months ago