 using equation provided, plot
1/2Vn ^2 vs h.
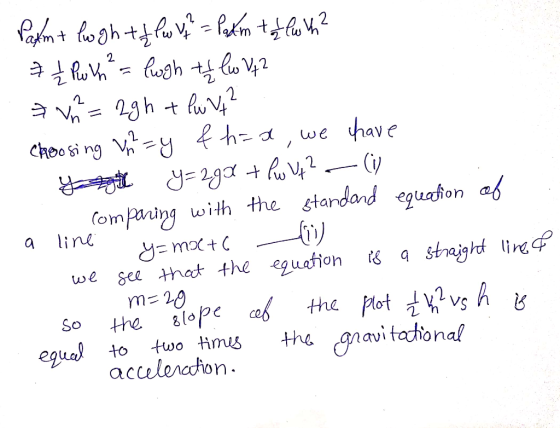
using equation provided, plot
1/2Vn ^2 vs h.
what is the slope
Homework Answers
Add Answer to:
using equation provided, plot
1/2Vn ^2 vs h.
what is the slope
u.m y Wive res...
Y=ax+b is the equation if a straight line. A student plot x vs y instead of...
Y=ax+b is the equation if a straight line. A student plot x vs y instead of y vs x, what will be the slope and the intercept on his graph in terms of a and b
1- What physical quantity is represented by the slope of a Position vs. Time plot? What...
1- What physical quantity is represented by the slope of a Position vs. Time plot? What are its dimensions? How did you know? Please explain. 2- What physical quantity is represented by the slope of a Velocity vs. Time plot? What are its dimensions? How did you figure it out? Please explain. 3- What would the Acceleration vs. Time plot look like for an object moving at constant velocity? Try drawing it and uploading a picture of your graph.
What is the slope of log Im vs log R plot? 4. What is the slope of log Im vs log R plot? 4.
 What is the slope of log Im vs log R plot? 4.
What is the slope of log Im vs log R plot? 4.
What is the slope of log Im vs log R plot? 4.
The slope and the y-intercept of the plot of [NO2]–1 vs time are, respectively, 0.0533 M–1...
The slope and the y-intercept of the plot of [NO2]–1 vs time are, respectively, 0.0533 M–1 s–1 and 17.4 M–1. How long will it take for the concentration of NO2 to drop to 25.0% of [NO2]o?
The Arrhenius equation is k = Ae–Ea/RT. The slope of a plot of ln k vs....
The Arrhenius equation is k = Ae–Ea/RT. The slope of a plot of ln k vs. 1/T is equal to A) -k B) k C) Ea D) -Ea/R E) A
Y= a X + b is the equation of a straight line. A student plot X...
Y= a X + b is the equation of a straight line. A student plot X vs Y instead of Y vs X, what will be the slope and the intercept on his graph in terms of a and b.
Y = a X + b is the equation of a straight line. A student plot...
 Y = a X + b is the equation of a straight line. A student plot X vs Y instead of Y vs X, what will be the slope and the intercept on his graph in terms of a and b. Given that B + 16R-d/L = S-Q, B is the dependent variable and L is the independent variable, what is the expression for the slope and intercept of the linear graph?
using microsoft excel, plot the absorbance (y-axis) vs. the concentration of each FAS standard standard (in g/ml) Use the method of least squares (linear regression) to determine the slope, intercept,...
using microsoft excel, plot the absorbance (y-axis) vs. the concentration of each FAS standard standard (in g/ml) Use the method of least squares (linear regression) to determine the slope, intercept, and correlation coefficient. Compare your slope with the literature value of 11,100 liter*mol^-1*cm^-1. You will have to convert your slope to have the same units as the literature value. Please do this unit conversion in your notebook. (FW FAS=392.13) Absorbance was read at 508 nm in a 1 cm curvette....
(i) Plot the current density vs. overvoltage (j vs. h) relationship – the Butler-Volmer equation –...
(i) Plot the current density vs. overvoltage (j vs. h) relationship – the Butler-Volmer equation – for this reaction in the range h = -0.5 to 0.5 V. Assume a transfer coefficient a = 0.5 and vary the exchange current density: j0 = 10-3, 10-6, 10-9 A/cm2. Define the sign conventions for current and overvoltage. (ii) Plot the j vs. h relationship for j0 = 10-6 A/cm2 and a = 0.25, 0.5 and 0.75. (iii) Plot log½j½ vs. h curves...
Square both sides of the equation above. If we plot T2 vs. m, What is the...
 Square both sides of the equation above. If we plot
T2 vs. m, What is the expression for the slope of this
graph?
An unstretched vertical spring has length of L1 =
7.35 +/- 0.05 cm. A 500.0 +/- 0.1 g mass is hung on the spring
which then stretches it to a length L2 = 12.50 +/- 0.05
cm. Calculate the spring constant k and its uncertainty. Show your
workings.
Square both sides of the equation above. If we...
Square both sides of the equation above. If we plot
T2 vs. m, What is the expression for the slope of this
graph?
An unstretched vertical spring has length of L1 =
7.35 +/- 0.05 cm. A 500.0 +/- 0.1 g mass is hung on the spring
which then stretches it to a length L2 = 12.50 +/- 0.05
cm. Calculate the spring constant k and its uncertainty. Show your
workings.
Square both sides of the equation above. If we...
 What is the slope of log Im vs log R plot? 4.
What is the slope of log Im vs log R plot? 4.
What is the slope of log Im vs log R plot? 4.
 Y = a X + b is the equation of a straight line. A student plot X vs Y instead of Y vs X, what will be the slope and the intercept on his graph in terms of a and b. Given that B + 16R-d/L = S-Q, B is the dependent variable and L is the independent variable, what is the expression for the slope and intercept of the linear graph?
 Square both sides of the equation above. If we plot
T2 vs. m, What is the expression for the slope of this
graph?
An unstretched vertical spring has length of L1 =
7.35 +/- 0.05 cm. A 500.0 +/- 0.1 g mass is hung on the spring
which then stretches it to a length L2 = 12.50 +/- 0.05
cm. Calculate the spring constant k and its uncertainty. Show your
workings.
Square both sides of the equation above. If we...
Square both sides of the equation above. If we plot
T2 vs. m, What is the expression for the slope of this
graph?
An unstretched vertical spring has length of L1 =
7.35 +/- 0.05 cm. A 500.0 +/- 0.1 g mass is hung on the spring
which then stretches it to a length L2 = 12.50 +/- 0.05
cm. Calculate the spring constant k and its uncertainty. Show your
workings.
Square both sides of the equation above. If we...
Most questions answered within 3 hours.
-
Where is the error in this code sequence?
String s1 = "Hello";
String s2 = "ello";...
asked 10 months ago -
Financial data for Joel de Paris, Inc., for last year
follow:
Joel de Paris, Inc.
Balance...
asked 10 months ago -
Consider this reaction:
Al2(SO4)3 (aq)+ BaCl3
(aq) Al2Cl6 (aq)- +
3BaSO4(s) . What is the...
asked 10 months ago -
Suppose that Savneet is considering increasing her
recent random sample from 20 car rentals to 40...
asked 10 months ago -
Trucks arrive at an unloading terminal at an average rate of 120
per hour.
Trucks arrive...
asked 10 months ago -
Why are methanol and ethanol completely soluble in water while
octanol is not very little soluble....
asked 10 months ago -
A facilities manager at a university reads in a research report
that the mean amount of...
asked 10 months ago -
When the CuSO4 is rehydrated by adding water to the anhydrous
compound, is this an endothermic...
asked 10 months ago -
A ray of sunlight is passing from diamond into crown glass; the
angle of incidence is...
asked 10 months ago -
A block of mass 0.249 kg is placed on top of a light, vertical
spring of...
asked 10 months ago -
how do the kidneys compensate in the presences of acidosis
a) trigger hyperventilate
b) reserve acid...
asked 10 months ago -
Question 501 pts
The rental rate of capital to the firm increases. Which of the
following...
asked 10 months ago