2. A perfectly competitive potato farm is currently in long run equilibrium. a. Graph the firm...
Homework Answers
2. a. The firm in long run equilibrium is shown below. Current price is P0 and market quantity is Q0. Each firm produces q0 units.

b. The demand for potatoes increases. This shifts the demand curve in the diagram for market. New price is P1 which causes each firm to supply more at q1 and earn economic profit. This is because firm cannot influence the price and produces what it can at the given price using MC curve

c.In the long run, new firms enter the market which increases the market supply and causes the price to decline. This results in decreasing the profit so that all firms now earn no economic profit in the new long run equilibrium. Existing firms however produce the same but due to greater number of firms total production increases to Q1
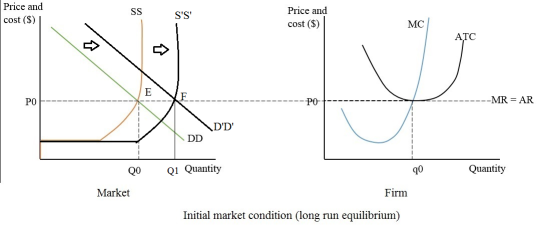
d. Market price does not change. Market quantity increases due to increased number of firms. However since price is unchanged each firm produces the same output level
Add Answer to:
2. A perfectly competitive potato farm is currently in long
run equilibrium.
a. Graph the firm...
A monopolistically competitive sneaker firm is currently in long run equilibrium. Graph the firm in long...
A monopolistically competitive sneaker firm is currently in long run equilibrium. Graph the firm in long run equilibrium. Be sure to label all of the curves and the profit-maximizing price and quantity. The price of rubber decreases. Rubber is a major component in the production of sneakers. Draw a new graph that shows the change in the profit maximizing price and quantity of sneakers. Be sure to shade the area of loss or profit.
1. A monopolistically competitive sneaker firm is currently in long run equilibrium. a. Graph the firm...
1. A monopolistically competitive sneaker firm is currently in long run equilibrium. a. Graph the firm in long run equilibrium. Be sure to label all of the curves and the profit-maximizing price and quantity. b. The price of rubber decreases. Rubber is a major component in the production of sneakers. Draw a new graph that shows the change in the profit maximizing price and quantity of sneakers. Be sure to shade the area of loss or profit. .
in short run this firm will___ in long run this firm will___ a. Label the graph...
 in short run this firm will___
in long run this firm will___
a. Label the graph that represents the market "Market" and the graph that depicts a perfectly competitive representative firm for this industry "Firm". Label the axes and all of the curves. (4 points) b. Label market equilibrium. Draw in the firm's price line. Indicate the profit maximizing level of output for the firm and illustrate the area of profits/losses. (4 points)
in short run this firm will___
in long run this firm will___
a. Label the graph that represents the market "Market" and the graph that depicts a perfectly competitive representative firm for this industry "Firm". Label the axes and all of the curves. (4 points) b. Label market equilibrium. Draw in the firm's price line. Indicate the profit maximizing level of output for the firm and illustrate the area of profits/losses. (4 points)
Long Run Equilibrium 4. Suppose each firm in a perfectly competitive industry has the same long...
Long Run Equilibrium 4. Suppose each firm in a perfectly competitive industry has the same long run total cost function T C(q) = 16+q^2 . The market demand curve is QD = 100−P. (a) What 3 equations define a Long Run Perfectly Competitive Equilibrium? (b) How much quantity q ∗ does each firm produce in Long Run Perfectly Competitive Equilibrium? (c) What is the market price P ∗ in this equilibrium? (d) Find the market quantity Q∗ . ( e)...
The following graph shows the daily cost curves of a firm operating in a perfectly competitive...
 The following graph shows the daily cost curves of a firm operating in a perfectly competitive market. Suppose the market price for the good is $80 per unit Use the blue rectangle (circle symbols) to shade the area representing the firm's profit or loss at the market price of $80 per unit if the firm chooses to produce the profit-maximizing quantity of output Profit or Loss PRICE AND COST (Dollars) QUANTITY (Thousands of units) At the market price of $80...
32. Ina sells her homegrown pumpkins at a roadside stand. Assume that the industry is perfectly competitive. The graph below represents the short run cost curves for Ina's pumpkins farm Part 1: I...
 32. Ina sells her homegrown pumpkins at a roadside stand. Assume that the industry is perfectly competitive. The graph below represents the short run cost curves for Ina's pumpkins farm Part 1: In a separate model, draw the graph for the entire pumpkins market when the market price of pumpkins is S10. Part 2: (a) On Ina's pumpkins farm graph, label the ATC, AVC and MC curves. (b) Given the price in the pumpkins market, draw and label the market...
Draw the MC, MR, ATC, and long-run ATC curves for a perfectly competitive firm in long-run...
Draw the MC, MR, ATC, and long-run ATC curves for a perfectly competitive firm in long-run equilibrium. Explain the relationship between those curves. Next, draw another graph showing long-run equilibrium for the perfectly competitive market. What is the relationship between the two graphs?
Consider a firm in a market that is in a long-run, perfectly competitive equilibrium. If the...
 Consider a firm in a market that is in a long-run, perfectly competitive equilibrium. If the firm has total costs of C(q) = 100 +, and the firm selects its quantity in order to maximize its profit, what is the equilibrium market price?
1. Draw two graphs. On the first, show the short-run profit maximizing output of an individual...
1. Draw two graphs. On the first, show the short-run profit maximizing output of an individual firm earning an economic profit, including MR, MC, AVC, and ATC. On the second, show the short-run market equilibrium price and quantity. Explain how the industry supply curve and the market equilibrium price and quantity are determined. 2. What is the relationship between the price on the two graphs? Why does this relationship exist? 3. Explain why a firm in a perfectly competitive industry...
5. Short-run supply and long-run equilibrium Consider the perfectly competitive market for steel. Assume that, regardless...
 5. Short-run supply and long-run equilibrium Consider the perfectly competitive market for steel. Assume that, regardless of how many firms are in the industry, every firm in the industry is identical and faces the marginal cost (MC), average total cost (ATC), and average variable cost (AVC) curves shown on the following graph. COSTS (Dollars per ton) + MC D AVC 0 10 90 100 20 30 40 50 60 70 80 QUANTITY (Thousands of tons) The following diagram shows the...
 in short run this firm will___
in long run this firm will___
a. Label the graph that represents the market "Market" and the graph that depicts a perfectly competitive representative firm for this industry "Firm". Label the axes and all of the curves. (4 points) b. Label market equilibrium. Draw in the firm's price line. Indicate the profit maximizing level of output for the firm and illustrate the area of profits/losses. (4 points)
in short run this firm will___
in long run this firm will___
a. Label the graph that represents the market "Market" and the graph that depicts a perfectly competitive representative firm for this industry "Firm". Label the axes and all of the curves. (4 points) b. Label market equilibrium. Draw in the firm's price line. Indicate the profit maximizing level of output for the firm and illustrate the area of profits/losses. (4 points)
 The following graph shows the daily cost curves of a firm operating in a perfectly competitive market. Suppose the market price for the good is $80 per unit Use the blue rectangle (circle symbols) to shade the area representing the firm's profit or loss at the market price of $80 per unit if the firm chooses to produce the profit-maximizing quantity of output Profit or Loss PRICE AND COST (Dollars) QUANTITY (Thousands of units) At the market price of $80...
 32. Ina sells her homegrown pumpkins at a roadside stand. Assume that the industry is perfectly competitive. The graph below represents the short run cost curves for Ina's pumpkins farm Part 1: In a separate model, draw the graph for the entire pumpkins market when the market price of pumpkins is S10. Part 2: (a) On Ina's pumpkins farm graph, label the ATC, AVC and MC curves. (b) Given the price in the pumpkins market, draw and label the market...
 Consider a firm in a market that is in a long-run, perfectly competitive equilibrium. If the firm has total costs of C(q) = 100 +, and the firm selects its quantity in order to maximize its profit, what is the equilibrium market price?
 5. Short-run supply and long-run equilibrium Consider the perfectly competitive market for steel. Assume that, regardless of how many firms are in the industry, every firm in the industry is identical and faces the marginal cost (MC), average total cost (ATC), and average variable cost (AVC) curves shown on the following graph. COSTS (Dollars per ton) + MC D AVC 0 10 90 100 20 30 40 50 60 70 80 QUANTITY (Thousands of tons) The following diagram shows the...
Most questions answered within 3 hours.
-
Where is the error in this code sequence?
String s1 = "Hello";
String s2 = "ello";...
asked 10 months ago -
Financial data for Joel de Paris, Inc., for last year
follow:
Joel de Paris, Inc.
Balance...
asked 10 months ago -
Consider this reaction:
Al2(SO4)3 (aq)+ BaCl3
(aq) Al2Cl6 (aq)- +
3BaSO4(s) . What is the...
asked 10 months ago -
Suppose that Savneet is considering increasing her
recent random sample from 20 car rentals to 40...
asked 10 months ago -
Trucks arrive at an unloading terminal at an average rate of 120
per hour.
Trucks arrive...
asked 10 months ago -
Why are methanol and ethanol completely soluble in water while
octanol is not very little soluble....
asked 10 months ago -
A facilities manager at a university reads in a research report
that the mean amount of...
asked 10 months ago -
When the CuSO4 is rehydrated by adding water to the anhydrous
compound, is this an endothermic...
asked 10 months ago -
A ray of sunlight is passing from diamond into crown glass; the
angle of incidence is...
asked 10 months ago -
A block of mass 0.249 kg is placed on top of a light, vertical
spring of...
asked 10 months ago -
how do the kidneys compensate in the presences of acidosis
a) trigger hyperventilate
b) reserve acid...
asked 10 months ago -
Question 501 pts
The rental rate of capital to the firm increases. Which of the
following...
asked 10 months ago