This is a little long, but I need help figuring it out. I see other questions...
This is a little long, but I need help figuring it out. I see other questions close to this one, but not exactly, so I'm confused.
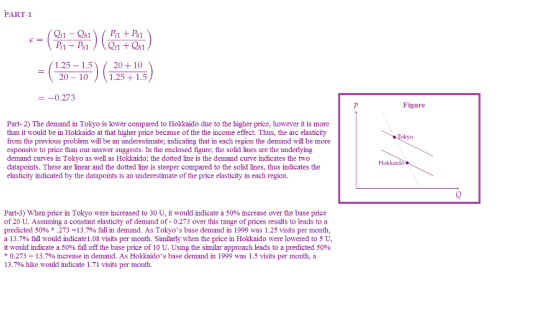
Suppose you are collecting data from a country like Japan where the government sets the price of health care. Each prefecture in Japan has a different set of prices.
-Table 2.2 Outpatient utilization in Tokyo & Hokkaido, 1999
Region: Oupatient visits Price per visit
Tokyo 1.25/month 20 yen
Hokkaido 1.5/month 10 yen
A) What is the arc price elasticity of demand for healthcare consumers in japan?
B) Suppose that incomes are generally much higher in Tokyo than Hokkaido. Is your answer to the last question an overestimate or underestimate of price elasticity? Justify your answer.
C) Using your estimated elasticity, what would the demand for health care be if the price in Tokyo was raised to 30 yen per visit? What would the demand in Hokkaido be ifthe price were lowered to 5 yen per visit?
D) Calculate the price elasticity of demand for health care in Japan using only data from year 2000:
Tokyo 1.0/month 30 yen
Hokkaido 1.2/month 15 yen
E) use data from both years to calculate the elasticity of demand for health care for each city seperately.
F) Using your estimated elasticities, what would the demand for health care in each prefecture be if the price were raised to 60 yen per visit next year for coth cities?
G) Combine the estimates to get a single esti,ate of the price elasticity of health care demand for all of Japan. Assume that Tokyo is 5 times the size of Hokkaido.
***I know this is long, but I do need help and understanding on this. Thank you!!
Homework Answers

Add Answer to:
This is a little long, but I need help figuring it out. I see
other questions...
Need help, YOU DONT HAVE TO DO A OR B. I understand those. Its mainly D...
 Need help, YOU DONT HAVE TO DO A OR B. I understand those. Its
mainly D through G that I have trouble with. Feel free just to do
those.
Suppose you are collecting data from a country like Japan where the government sets the price of health care. Each prefecture in Japan has a different set of prices (for example, Tokyo has higher prices than rural Hokkaido). Data for 1999 is displayed in Table 2.12 11 Table 2.12. Outpatient utilization...
Need help, YOU DONT HAVE TO DO A OR B. I understand those. Its
mainly D through G that I have trouble with. Feel free just to do
those.
Suppose you are collecting data from a country like Japan where the government sets the price of health care. Each prefecture in Japan has a different set of prices (for example, Tokyo has higher prices than rural Hokkaido). Data for 1999 is displayed in Table 2.12 11 Table 2.12. Outpatient utilization...
Need help, please show work Suppose you are collecting data from a country like Japan where...
 Need help, please show work
Suppose you are collecting data from a country like Japan where the government sets the price of health care. Each prefecture in Japan has a different set of prices (for example, Tokyo has higher prices than rural Hokkaido). Data for 1999 is displayed in Table 2.12. 11 Table 2.12. Outpatient utilization in Tokyo and Hokkaido, 1999. RegionOutpatient visits Price/visit Tokyo 1.25/month Hokkaido 1.5/month 20Y 10¥ What is the arc price elasticity of demand for health...
Need help, please show work
Suppose you are collecting data from a country like Japan where the government sets the price of health care. Each prefecture in Japan has a different set of prices (for example, Tokyo has higher prices than rural Hokkaido). Data for 1999 is displayed in Table 2.12. 11 Table 2.12. Outpatient utilization in Tokyo and Hokkaido, 1999. RegionOutpatient visits Price/visit Tokyo 1.25/month Hokkaido 1.5/month 20Y 10¥ What is the arc price elasticity of demand for health...
I have mostly completed this question. Need help on whether or not my work is correct,...
 I have mostly completed this question. Need help on whether or
not my work is correct, and help on blank ones
11. Suppose you are collecting data from a country like Japan
where the government sets the price of health care. Each prefecture
in Japan has a different set of prices (for example,Tokyo has higher
prices than rural Hokkaido).Data for 1999 is displayed in Table
2.12.)
a. What is the arc price elasticity of demand for health care
consumers in...
I have mostly completed this question. Need help on whether or
not my work is correct, and help on blank ones
11. Suppose you are collecting data from a country like Japan
where the government sets the price of health care. Each prefecture
in Japan has a different set of prices (for example,Tokyo has higher
prices than rural Hokkaido).Data for 1999 is displayed in Table
2.12.)
a. What is the arc price elasticity of demand for health care
consumers in...
Suppose you are collecting data from a country like Japan where the government sets the price...
 Suppose you are collecting data from a country like Japan where the government sets the price of health care. Each prefecture in Japan has a different set of prices (for example, Tokyo has higher prices than rural Hokkaido). Data for 2015 is displayed in Table 1. What is the arc price elasticity of demand for health care consumers in Japan (using only this data)? Suppose that incomes are generally much higher in Tokyo than Hokkaido. Is your answer to the...
(12 points) Suppose you are collecting data from a country like Japan where the government sets...
 (12 points) Suppose you are collecting data from a country like Japan where the government sets the price of health care. Each prefecture in Japan has a different set of prices. Data from 1999 are displayed in the following table: Outpatient visits 1 per month 2 per month Price per visit Region Tokyo Hokkaido 25 yen 15 yen a. What is the arc price elasticity of demand for health care in Japan based on these data? b. Suppose that incomes...
I just need help with parts B and C, I know those answers are correct but...
I just need help with parts B and C, I know those answers are correct but have no clue how to do them. Please show step by step! Thank you!:) A) Assume the following: Number of college students in the market: 25,000 Average number of copies per student per year 125 Your company’s estimated share of the total market 13% Total annual market demand 3,125,000 Estimated annual company demand 406,250 Estimated monthly demand 33,854 Estimated weekly demand 7,813 Given the following for your copy business: Annual Expenses:...
I really need help figuring out the Tarif amount and thre revenue it would raise for...
 I really need help figuring out the Tarif amount and thre
revenue it would raise for the Government. This is based on a Micro
Economics 304 question and I could really use some help with the
math. It is a bit to vague for me to figure out on my own, thank
you.
P.S. I really need this figured out by 03/21.
Sooy DOMEST20 DED ODMESTIC SUPPLY Price (pollars per Busher 260- - Pu/world Price) 30 60 90 no 159...
I really need help figuring out the Tarif amount and thre
revenue it would raise for the Government. This is based on a Micro
Economics 304 question and I could really use some help with the
math. It is a bit to vague for me to figure out on my own, thank
you.
P.S. I really need this figured out by 03/21.
Sooy DOMEST20 DED ODMESTIC SUPPLY Price (pollars per Busher 260- - Pu/world Price) 30 60 90 no 159...
Hello I need help with questions 2 until question 9 if you can do that for me thanks. I need to s...
 Hello I need help with questions 2 until question 9 if you can do
that for me thanks. I need to see all work and answers clearly.
Thanks for the help I know it’s a lot but I really need help with
this it’s a project that’s due tonight. Thanks !
27 27889.0526471 10.12 1.09 28 SUMMARY OUTPUT 29 30 Regression Statistics 1 Multiple F 0.986442 32 R Square 0.973068 33 Adjusted 0.967681 34 Standard I 32.55341 35 Observati 36...
Hello I need help with questions 2 until question 9 if you can do
that for me thanks. I need to see all work and answers clearly.
Thanks for the help I know it’s a lot but I really need help with
this it’s a project that’s due tonight. Thanks !
27 27889.0526471 10.12 1.09 28 SUMMARY OUTPUT 29 30 Regression Statistics 1 Multiple F 0.986442 32 R Square 0.973068 33 Adjusted 0.967681 34 Standard I 32.55341 35 Observati 36...
this question was crazy long. I need help on parts A-G. I'd really appreciate your help...
 this question was crazy long. I need help on parts
A-G. I'd really appreciate your help on this long problem and I
will definitely be giving your answer a big thumbs up. thank you so
much.
QM295Exam Fall 2019.doc - Compatibility Mode erences Mailings Review View Help Search 7. A manufacturer has developed a new design for circuit panels. Marketing studies have shown that annual demand is estimated by the equation x=f(p) - 200,000 - 500p, or p= 400 -...
this question was crazy long. I need help on parts
A-G. I'd really appreciate your help on this long problem and I
will definitely be giving your answer a big thumbs up. thank you so
much.
QM295Exam Fall 2019.doc - Compatibility Mode erences Mailings Review View Help Search 7. A manufacturer has developed a new design for circuit panels. Marketing studies have shown that annual demand is estimated by the equation x=f(p) - 200,000 - 500p, or p= 400 -...
Hello I need help with questions 2 until 9 if possible. If you can please show all work and answe...
 Hello I need help with questions 2 until 9 if possible. If you
can please show all work and answers clearly. Thanks for all the
help have this project that’s due tonight so I need help on
thanks.
27 27889.0526471 10.12 1.09 28 SUMMARY OUTPUT 29 30 Regression Statistics 1 Multiple F 0.986442 32 R Square 0.973068 33 Adjusted 0.967681 34 Standard I 32.55341 35 Observati 36 37 ANOVA 38 39 Regressio 40 Residual 41 Total 42 43 44 Intercept...
Hello I need help with questions 2 until 9 if possible. If you
can please show all work and answers clearly. Thanks for all the
help have this project that’s due tonight so I need help on
thanks.
27 27889.0526471 10.12 1.09 28 SUMMARY OUTPUT 29 30 Regression Statistics 1 Multiple F 0.986442 32 R Square 0.973068 33 Adjusted 0.967681 34 Standard I 32.55341 35 Observati 36 37 ANOVA 38 39 Regressio 40 Residual 41 Total 42 43 44 Intercept...
 Need help, YOU DONT HAVE TO DO A OR B. I understand those. Its
mainly D through G that I have trouble with. Feel free just to do
those.
Suppose you are collecting data from a country like Japan where the government sets the price of health care. Each prefecture in Japan has a different set of prices (for example, Tokyo has higher prices than rural Hokkaido). Data for 1999 is displayed in Table 2.12 11 Table 2.12. Outpatient utilization...
Need help, YOU DONT HAVE TO DO A OR B. I understand those. Its
mainly D through G that I have trouble with. Feel free just to do
those.
Suppose you are collecting data from a country like Japan where the government sets the price of health care. Each prefecture in Japan has a different set of prices (for example, Tokyo has higher prices than rural Hokkaido). Data for 1999 is displayed in Table 2.12 11 Table 2.12. Outpatient utilization...
 Need help, please show work
Suppose you are collecting data from a country like Japan where the government sets the price of health care. Each prefecture in Japan has a different set of prices (for example, Tokyo has higher prices than rural Hokkaido). Data for 1999 is displayed in Table 2.12. 11 Table 2.12. Outpatient utilization in Tokyo and Hokkaido, 1999. RegionOutpatient visits Price/visit Tokyo 1.25/month Hokkaido 1.5/month 20Y 10¥ What is the arc price elasticity of demand for health...
Need help, please show work
Suppose you are collecting data from a country like Japan where the government sets the price of health care. Each prefecture in Japan has a different set of prices (for example, Tokyo has higher prices than rural Hokkaido). Data for 1999 is displayed in Table 2.12. 11 Table 2.12. Outpatient utilization in Tokyo and Hokkaido, 1999. RegionOutpatient visits Price/visit Tokyo 1.25/month Hokkaido 1.5/month 20Y 10¥ What is the arc price elasticity of demand for health...
 I have mostly completed this question. Need help on whether or
not my work is correct, and help on blank ones
11. Suppose you are collecting data from a country like Japan
where the government sets the price of health care. Each prefecture
in Japan has a different set of prices (for example,Tokyo has higher
prices than rural Hokkaido).Data for 1999 is displayed in Table
2.12.)
a. What is the arc price elasticity of demand for health care
consumers in...
I have mostly completed this question. Need help on whether or
not my work is correct, and help on blank ones
11. Suppose you are collecting data from a country like Japan
where the government sets the price of health care. Each prefecture
in Japan has a different set of prices (for example,Tokyo has higher
prices than rural Hokkaido).Data for 1999 is displayed in Table
2.12.)
a. What is the arc price elasticity of demand for health care
consumers in...
 Suppose you are collecting data from a country like Japan where the government sets the price of health care. Each prefecture in Japan has a different set of prices (for example, Tokyo has higher prices than rural Hokkaido). Data for 2015 is displayed in Table 1. What is the arc price elasticity of demand for health care consumers in Japan (using only this data)? Suppose that incomes are generally much higher in Tokyo than Hokkaido. Is your answer to the...
 (12 points) Suppose you are collecting data from a country like Japan where the government sets the price of health care. Each prefecture in Japan has a different set of prices. Data from 1999 are displayed in the following table: Outpatient visits 1 per month 2 per month Price per visit Region Tokyo Hokkaido 25 yen 15 yen a. What is the arc price elasticity of demand for health care in Japan based on these data? b. Suppose that incomes...
 I really need help figuring out the Tarif amount and thre
revenue it would raise for the Government. This is based on a Micro
Economics 304 question and I could really use some help with the
math. It is a bit to vague for me to figure out on my own, thank
you.
P.S. I really need this figured out by 03/21.
Sooy DOMEST20 DED ODMESTIC SUPPLY Price (pollars per Busher 260- - Pu/world Price) 30 60 90 no 159...
I really need help figuring out the Tarif amount and thre
revenue it would raise for the Government. This is based on a Micro
Economics 304 question and I could really use some help with the
math. It is a bit to vague for me to figure out on my own, thank
you.
P.S. I really need this figured out by 03/21.
Sooy DOMEST20 DED ODMESTIC SUPPLY Price (pollars per Busher 260- - Pu/world Price) 30 60 90 no 159...
 Hello I need help with questions 2 until question 9 if you can do
that for me thanks. I need to see all work and answers clearly.
Thanks for the help I know it’s a lot but I really need help with
this it’s a project that’s due tonight. Thanks !
27 27889.0526471 10.12 1.09 28 SUMMARY OUTPUT 29 30 Regression Statistics 1 Multiple F 0.986442 32 R Square 0.973068 33 Adjusted 0.967681 34 Standard I 32.55341 35 Observati 36...
Hello I need help with questions 2 until question 9 if you can do
that for me thanks. I need to see all work and answers clearly.
Thanks for the help I know it’s a lot but I really need help with
this it’s a project that’s due tonight. Thanks !
27 27889.0526471 10.12 1.09 28 SUMMARY OUTPUT 29 30 Regression Statistics 1 Multiple F 0.986442 32 R Square 0.973068 33 Adjusted 0.967681 34 Standard I 32.55341 35 Observati 36...
 this question was crazy long. I need help on parts
A-G. I'd really appreciate your help on this long problem and I
will definitely be giving your answer a big thumbs up. thank you so
much.
QM295Exam Fall 2019.doc - Compatibility Mode erences Mailings Review View Help Search 7. A manufacturer has developed a new design for circuit panels. Marketing studies have shown that annual demand is estimated by the equation x=f(p) - 200,000 - 500p, or p= 400 -...
this question was crazy long. I need help on parts
A-G. I'd really appreciate your help on this long problem and I
will definitely be giving your answer a big thumbs up. thank you so
much.
QM295Exam Fall 2019.doc - Compatibility Mode erences Mailings Review View Help Search 7. A manufacturer has developed a new design for circuit panels. Marketing studies have shown that annual demand is estimated by the equation x=f(p) - 200,000 - 500p, or p= 400 -...
 Hello I need help with questions 2 until 9 if possible. If you
can please show all work and answers clearly. Thanks for all the
help have this project that’s due tonight so I need help on
thanks.
27 27889.0526471 10.12 1.09 28 SUMMARY OUTPUT 29 30 Regression Statistics 1 Multiple F 0.986442 32 R Square 0.973068 33 Adjusted 0.967681 34 Standard I 32.55341 35 Observati 36 37 ANOVA 38 39 Regressio 40 Residual 41 Total 42 43 44 Intercept...
Hello I need help with questions 2 until 9 if possible. If you
can please show all work and answers clearly. Thanks for all the
help have this project that’s due tonight so I need help on
thanks.
27 27889.0526471 10.12 1.09 28 SUMMARY OUTPUT 29 30 Regression Statistics 1 Multiple F 0.986442 32 R Square 0.973068 33 Adjusted 0.967681 34 Standard I 32.55341 35 Observati 36 37 ANOVA 38 39 Regressio 40 Residual 41 Total 42 43 44 Intercept...
Most questions answered within 3 hours.
-
Where is the error in this code sequence?
String s1 = "Hello";
String s2 = "ello";...
asked 10 months ago -
Financial data for Joel de Paris, Inc., for last year
follow:
Joel de Paris, Inc.
Balance...
asked 10 months ago -
Consider this reaction:
Al2(SO4)3 (aq)+ BaCl3
(aq) Al2Cl6 (aq)- +
3BaSO4(s) . What is the...
asked 10 months ago -
Suppose that Savneet is considering increasing her
recent random sample from 20 car rentals to 40...
asked 10 months ago -
Trucks arrive at an unloading terminal at an average rate of 120
per hour.
Trucks arrive...
asked 10 months ago -
Why are methanol and ethanol completely soluble in water while
octanol is not very little soluble....
asked 10 months ago -
A facilities manager at a university reads in a research report
that the mean amount of...
asked 10 months ago -
When the CuSO4 is rehydrated by adding water to the anhydrous
compound, is this an endothermic...
asked 10 months ago -
A ray of sunlight is passing from diamond into crown glass; the
angle of incidence is...
asked 10 months ago -
A block of mass 0.249 kg is placed on top of a light, vertical
spring of...
asked 10 months ago -
how do the kidneys compensate in the presences of acidosis
a) trigger hyperventilate
b) reserve acid...
asked 10 months ago -
Question 501 pts
The rental rate of capital to the firm increases. Which of the
following...
asked 10 months ago