Horizontal Analysis of the Income Statement
Income statement data for Boone Company for two recent years ended December 31, are as follows:

Homework Answers
| Boone Company | ||||
| Comparative Income Statement | ||||
| For the Years Ended December 31, 20— | ||||
| Current year Amount | Previous year Amount | Increase (Decrease) Amount | Increase (Decrease) Percent | |
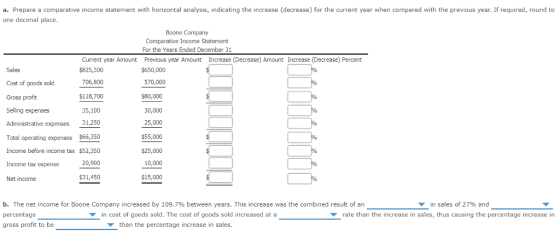
| Sales | $825,500 | $650,000 | $175,500 | 27.0% |
| Cost of goods sold | 706800 | 570000 | $136,800 | 24.0% |
| Gross profit | $118,700 | $80,000 | $38,700 | 48.4% |
| Selling expenses | 35100 | 30000 | $5,100 | 17.0% |
| Administrative expenses | 31250 | 25000 | $6,250 | 25.0% |
| Total operating expenses | $66,350 | $55,000 | $11,350 | 20.6% |
| Income before income tax | $52,350 | $25,000 | $27,350 | 109.4% |
| Income tax expense | $20,900 | $10,000 | $10,900 | 109.0% |
| Net income | $31,450 | $15,000 | $16,450 | 109.7% |
| The net income for Boone Company increased by 109.7% between years. This increase was the combined result of an in sales of 27% and percentage in cost of goods sold. The cost of goods sold increased at a rate than the increase in sales, thus causing the percentage increase in gross profit to be than the percentage increase in sales. | ||||
Add Answer to:
Horizontal Analysis of the Income Statement
Income statement data for Boone Company for two recent years...
2. Horizontal Analysis of the Income Statement Income statement data for Boone Company for two recent...
2. Horizontal Analysis of the Income Statement Income statement data for Boone Company for two recent years ended December 31, are as follows: Current Year Previous Year Sales $806,000 $650,000 Cost of goods sold 665,500 550,000 Gross profit $140,500 $100,000 Selling expenses $39,900 $35,000 Administrative expenses 36,600 30,000 Total operating expenses $76,500 $65,000 Income before income tax $64,000 $35,000 Income tax expenses 25,600 14,000 Net income $38,400 $21,000 a. Prepare a comparative income statement with horizontal analysis, indicating the increase...
Income statement data for Boone Company for two recent years ended December 31, are as follows:...
 Income statement data for Boone Company for two recent years ended December 31, are as follows: Sales Cost of goods sold Gross profit Selling expenses Administrative expenses Total operating expenses Income before income tax Income tax expenses Net income Current Year $844,800 728,000 $116,800 $35,380 32,500 $67,880 $48,920 19,600 $29,320 Previous Year $640,000 560,000 $80,000 $29,000 25,000 $54,000 $26,000 10,400 $15,600 a. Prepare a comparative income statement with horizontal analysis, indicating the increase (decrease) for the current year when compared...
Horizontal Analysis of the Income Statement Income statement data for Winthrop Company for two recent years...
 Horizontal Analysis of the Income Statement Income statement
data for Winthrop Company for two recent years ended December 31,
are as follows: Current Year Sales Cost of goods sold Gross profit
$665,600 567,000 Previous Year $520,000 450,000 $98,600 $70,000
Selling expenses$29,500 Administrative expenses 26,460 $25,000
21,000 $ 46,000 Total operating expenses$55,960 Income before
income tax$42,640 $ 24,000 Income tax expenses 17,1009,600 Net
income$ 25,540$ 14,400
Horizontal Analysis of the Income Statement Income statement data for Winthrop Company for two recent...
Horizontal Analysis of the Income Statement Income statement
data for Winthrop Company for two recent years ended December 31,
are as follows: Current Year Sales Cost of goods sold Gross profit
$665,600 567,000 Previous Year $520,000 450,000 $98,600 $70,000
Selling expenses$29,500 Administrative expenses 26,460 $25,000
21,000 $ 46,000 Total operating expenses$55,960 Income before
income tax$42,640 $ 24,000 Income tax expenses 17,1009,600 Net
income$ 25,540$ 14,400
Horizontal Analysis of the Income Statement Income statement data for Winthrop Company for two recent...
Horizontal Analysis of the Income Statement Income statement data for Winthrop Company for two recent years...
 Horizontal Analysis of the Income Statement Income statement data for Winthrop Company for two recent years ended December 31, are as follows: Current Year Previous Year Sales $460,800 375,000 $360,000 300,000 Cost of goods sold Gross profit $85,800 $60,000 Selling expenses $24,780 $21,000 Administrative expenses 22,680 18,000 Total operating expenses $47,460 $39,000 Income before income tax $21,000 $38,340 15,300 Income tax expenses 8,400 Net income $23,040 $12,600 a. Prepare a comparative income statement with horizontal analysis, indicating the increase (decrease)...
Horizontal Analysis of the Income Statement Income statement data for Winthrop Company for two recent years...
Horizontal Analysis of the Income Statement Income statement data for Winthrop Company for two recent years ended December 31, are as follows: Current Year Previous Year Sales $932,400 $740,000 Cost of goods sold 787,200 640,000 Gross profit $145,200 $100,000 Selling expenses $41,760 $36,000 Administrative expenses 37,200 30,000 Total operating expenses $78,960 $66,000 Income before income tax $66,240 $34,000 Income tax expenses 26,500 13,600 Net income $39,740 $20,400 a. Prepare a comparative income statement with horizontal analysis, indicating the increase (decrease)...
Horizontal Analysis of the Income Statement Income statement data for Winthrop Company for two recent years...
 Horizontal Analysis of the Income Statement Income statement data for Winthrop Company for two recent years ended December 31, are as follows: Current Year Previous Year Sales Cost of goods sold Gross profit Selling expenses Administrative expenses $541,200 456,000 585,200 $440,000 380,000 $23,730 $60,000 $21,000 18,000 $39,000 21,780 Total operating expenses $45,510 539,690 15,900 Income before income tax Income tax expenses $21,000 8,400 Net income $23,790 $12,600 a. Prepare a comparative income statement with horizontal analysis, indicating the increase (decrease)...
Horizontal Analysis of the Income Statement Income statement data for Winthrop Company for two recent years...
Horizontal Analysis of the Income Statement Income statement data for Winthrop Company for two recent years ended December 31, are as follows: Current Year Previous Year Sales $512,000 $400,000 Cost of goods sold 428,400 340,000 Gross profit $83,600 $60,000 Selling expenses $24,780 $21,000 Administrative expenses 22,680 18,000 Total operating expenses $47,460 $39,000 Income before income tax $36,140 $21,000 Income tax expenses 14,500 8,400 Net income $21,640 $12,600 a. Prepare a comparative income statement with horizontal analysis, indicating the increase (decrease)...
Horizontal Analysis of the Income Statement Income statement data for Winthrop Company for two recent years...
Horizontal Analysis of the Income Statement Income statement data for Winthrop Company for two recent years ended December 31, are as follows: Current Year Previous Year Sales $496,100 $410,000 Cost of goods sold 401,200 340,000 Gross profit $94,900 $70,000 Selling expenses $26,640 $24,000 Administrative expenses 23,800 20,000 Total operating expenses $50,440 $44,000 Income before income tax $44,460 $26,000 Income tax expenses 17,800 10,400 Net income $26,660 $15,600 a. Prepare a comparative income statement with horizontal analysis, indicating the increase (decrease)...
Horizontal Analysis of the Income Statement Income statement data for Winthrop Company for two recent years...
Horizontal Analysis of the Income Statement Income statement data for Winthrop Company for two recent years ended December 31, are as follows: Current Year Previous Year Sales $624,000 $480,000 Cost of goods sold 512,000 400,000 Gross profit $112,000 $80,000 Selling expenses $33,600 $28,000 Administrative expenses 30,720 24,000 Total operating expenses $64,320 $52,000 Income before income tax $47,680 $28,000 Income tax expenses 19,100 11,200 Net income $28,580 $16,800 a. Prepare a comparative income statement with horizontal analysis, indicating the increase (decrease)...
Horizontal Analysis of the Income Statement Income statement data for Winthrop Company for two recent years...
 Horizontal Analysis of the Income Statement Income statement data for Winthrop Company for two recent years ended December 31, are as follows Current Year $799,800 685,800 $114,000 $34,510 30,480 $64,990 $49,010 19,600 $29,410 Previous Year $620,000 540,000 $80,000 $29,000 24,000 $53,000 $27,000 10,800 $16,200 Sales Cost of goods sold Gross profit Selling expenses Administrative expenses Total operating expenses Income before income tax Income tax expenses Net income a. Prepare a comparative income statement with horizontal analysis, indicating the increase (decrease)...
 Income statement data for Boone Company for two recent years ended December 31, are as follows: Sales Cost of goods sold Gross profit Selling expenses Administrative expenses Total operating expenses Income before income tax Income tax expenses Net income Current Year $844,800 728,000 $116,800 $35,380 32,500 $67,880 $48,920 19,600 $29,320 Previous Year $640,000 560,000 $80,000 $29,000 25,000 $54,000 $26,000 10,400 $15,600 a. Prepare a comparative income statement with horizontal analysis, indicating the increase (decrease) for the current year when compared...
 Horizontal Analysis of the Income Statement Income statement
data for Winthrop Company for two recent years ended December 31,
are as follows: Current Year Sales Cost of goods sold Gross profit
$665,600 567,000 Previous Year $520,000 450,000 $98,600 $70,000
Selling expenses$29,500 Administrative expenses 26,460 $25,000
21,000 $ 46,000 Total operating expenses$55,960 Income before
income tax$42,640 $ 24,000 Income tax expenses 17,1009,600 Net
income$ 25,540$ 14,400
Horizontal Analysis of the Income Statement Income statement data for Winthrop Company for two recent...
Horizontal Analysis of the Income Statement Income statement
data for Winthrop Company for two recent years ended December 31,
are as follows: Current Year Sales Cost of goods sold Gross profit
$665,600 567,000 Previous Year $520,000 450,000 $98,600 $70,000
Selling expenses$29,500 Administrative expenses 26,460 $25,000
21,000 $ 46,000 Total operating expenses$55,960 Income before
income tax$42,640 $ 24,000 Income tax expenses 17,1009,600 Net
income$ 25,540$ 14,400
Horizontal Analysis of the Income Statement Income statement data for Winthrop Company for two recent...
 Horizontal Analysis of the Income Statement Income statement data for Winthrop Company for two recent years ended December 31, are as follows: Current Year Previous Year Sales $460,800 375,000 $360,000 300,000 Cost of goods sold Gross profit $85,800 $60,000 Selling expenses $24,780 $21,000 Administrative expenses 22,680 18,000 Total operating expenses $47,460 $39,000 Income before income tax $21,000 $38,340 15,300 Income tax expenses 8,400 Net income $23,040 $12,600 a. Prepare a comparative income statement with horizontal analysis, indicating the increase (decrease)...
 Horizontal Analysis of the Income Statement Income statement data for Winthrop Company for two recent years ended December 31, are as follows: Current Year Previous Year Sales Cost of goods sold Gross profit Selling expenses Administrative expenses $541,200 456,000 585,200 $440,000 380,000 $23,730 $60,000 $21,000 18,000 $39,000 21,780 Total operating expenses $45,510 539,690 15,900 Income before income tax Income tax expenses $21,000 8,400 Net income $23,790 $12,600 a. Prepare a comparative income statement with horizontal analysis, indicating the increase (decrease)...
 Horizontal Analysis of the Income Statement Income statement data for Winthrop Company for two recent years ended December 31, are as follows Current Year $799,800 685,800 $114,000 $34,510 30,480 $64,990 $49,010 19,600 $29,410 Previous Year $620,000 540,000 $80,000 $29,000 24,000 $53,000 $27,000 10,800 $16,200 Sales Cost of goods sold Gross profit Selling expenses Administrative expenses Total operating expenses Income before income tax Income tax expenses Net income a. Prepare a comparative income statement with horizontal analysis, indicating the increase (decrease)...
Most questions answered within 3 hours.
-
Where is the error in this code sequence?
String s1 = "Hello";
String s2 = "ello";...
asked 1 year ago -
Financial data for Joel de Paris, Inc., for last year
follow:
Joel de Paris, Inc.
Balance...
asked 1 year ago -
Consider this reaction:
Al2(SO4)3 (aq)+ BaCl3
(aq) Al2Cl6 (aq)- +
3BaSO4(s) . What is the...
asked 1 year ago -
Suppose that Savneet is considering increasing her
recent random sample from 20 car rentals to 40...
asked 1 year ago -
Trucks arrive at an unloading terminal at an average rate of 120
per hour.
Trucks arrive...
asked 1 year ago -
Why are methanol and ethanol completely soluble in water while
octanol is not very little soluble....
asked 1 year ago -
A facilities manager at a university reads in a research report
that the mean amount of...
asked 1 year ago -
When the CuSO4 is rehydrated by adding water to the anhydrous
compound, is this an endothermic...
asked 1 year ago -
A ray of sunlight is passing from diamond into crown glass; the
angle of incidence is...
asked 1 year ago -
A block of mass 0.249 kg is placed on top of a light, vertical
spring of...
asked 1 year ago -
how do the kidneys compensate in the presences of acidosis
a) trigger hyperventilate
b) reserve acid...
asked 1 year ago -
Question 501 pts
The rental rate of capital to the firm increases. Which of the
following...
asked 1 year ago