

Anyone know these values and can explain how to get them?
Homework Answers
Please provide rating... Let me know if you need any clarification
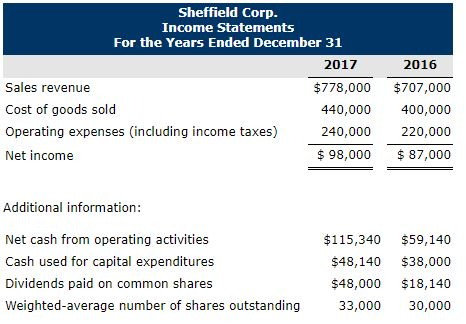
| a) Earning per share | |||||||
| =Net income/weighted average number of share outstanding | |||||||
| 2016 | 2017 | ||||||
| Net income | 87000 | 98000 | |||||
| Weighted average number of share outstanding | 30000 | 33000 | |||||
| Earning per share | 2.90 | 2.97 | |||||
| b) Working cpital | |||||||
| =Current asset - Current liabilities | |||||||
| 2016 | 2017 | ||||||
| Cash | 23140 | 31140 | |||||
| Receivable | 75300 | 83300 | |||||
| Other current asset | 86300 | 103300 | |||||
| Total current asset | 184740 | 217740 | |||||
| Total current liabilities | 73140 | 78140 | |||||
| Working capital = Current asset - Current liabilities | 111600 | 139600 | |||||
| c) Current ratio | |||||||
| =Current asset / Current liabilities | |||||||
| 2016 | 2017 | ||||||
| Total current asset | 184740 | 217740 | |||||
| Total current liabilities | 73140 | 78140 | |||||
| Current ratio = Current asset / Current liabilities | 2.5 | 2.8 | |||||
| Answer = | 2.5:1 | 2.8:1 | |||||
| d) Debt to asset ratio | |||||||
| =Total liabilities / Total asset | |||||||
| 2016 | 2017 | ||||||
| Total liabilities | 176440 | =73140+103300 | 171440 | =78140+93300 | |||
| Total asset | 728040 | 803040 | |||||
| Debt to asset ratio = | 24.2% | 21.3% | |||||
| e) Free cash flow | |||||||
| =Cash flow from operating activities - Capital expenditure - Dividend paid | |||||||
| 2016 | 2017 | ||||||
| Cash flow from operating activities | 59140 | 115340 | |||||
| Less : Capital expenditure | -38000 | -48140 | |||||
| less : Dividend paid | -18140 | -48000 | |||||
| Free cash flow | 3000 | 19200 | |||||
Add Answer to:
Anyone know these values and can explain how to get them?
Problem 2-6A Condensed balance sheet...
Condensed balance sheet and income statement data for Marigold Corp. are presented as follows. Marigold Corp....
Condensed balance sheet and income statement data for Marigold Corp. are presented as follows. Marigold Corp. Balance Sheets December 31 Assets 2017 2016 Cash $ 30,210 $ 22,210 Receivables (net) 82,900 74,900 Other current assets 102,900 85,900 Long-term investments 62,000 60,000 Property, plant, and equipment (net) 522,900 482,900 Total assets $ 800,910 725,910 Liabilities and Stockholders’ Equity Current liabilities $ 77,210 $ 72,210 Long-term liabilities 92,900 102,900 Common stock 342,900 312,900 Retained earnings 287,900 237,900 Total liabilities and stockholders’ equity...
Condensed balance sheet and income statement data for Wildhorse Co. are presented as follows. Wildhorse Co....
 Condensed balance sheet and income statement data for Wildhorse Co. are presented as follows. Wildhorse Co. Balance Sheets December 31 2017 2016 Assets Cash Receivables (net) Other current assets Long-term investments Property, plant, and equipment (net) Total assets Liabilities and Stockholders' Equity Current liabilities Long-term liabilities Common stock Retained earnings Total liabilities and stockholders' equity $ 32,660 82,400 102,400 62,000 522,400 $801,860 $24,660 74,400 85,400 60,000 482,400 726,860 $79,660 92,400 342,400 287,400 $ 801,860 $74,660 102,400 312,400 237,400 $726,860 Wildhorse...
condensed balance sheet and income statement for wild horse Cole are presented as follows compute these...
 condensed balance sheet and income statement for wild horse Cole
are presented as follows compute these values and ratios for 2016
and 2017 round earnings per share to two decimal places
Homework Required Question 7 of 7 CUTTUCC vatani DIICCL CITU HLUTI DOLCIFICHE UaLa TU VYTUS UU. ar 2016 Wildhorse Co. Balance Sheets December 31 Assets Cash Receivables (net) Other current assets Long-term investments Property, plant, and equipment (net) Total assets Liabilities and Stockholders' Equity Current liabilities Long-term liabilities Common...
condensed balance sheet and income statement for wild horse Cole
are presented as follows compute these values and ratios for 2016
and 2017 round earnings per share to two decimal places
Homework Required Question 7 of 7 CUTTUCC vatani DIICCL CITU HLUTI DOLCIFICHE UaLa TU VYTUS UU. ar 2016 Wildhorse Co. Balance Sheets December 31 Assets Cash Receivables (net) Other current assets Long-term investments Property, plant, and equipment (net) Total assets Liabilities and Stockholders' Equity Current liabilities Long-term liabilities Common...
[2] Financial ratios (58 points) Find the missing values on the balance sheet and the income...
 [2] Financial ratios (58 points) Find the missing values on the balance sheet and the income statement of Pensacola Railroads (in S millions). Start with the balance sheet, and then continue with the income statement. You can use the following ratios: NOTE: USE AVERAGE RECEIVABLES AND INVENTORY Debt Ratio loterest Coverage Ratio CurreatRatio Quick Ratio Cash Ratio 0.4 1.4 0.2 Average Collection Period (average receivables) Tax rate 73 das 40% Marks: 28 for balance sheet, 30 for income statement. Balance...
Condensed balance sheet and income statement data for Ayayai Corporation are presented here. AYAYAI CORPORATION Balance...
Condensed balance sheet and income statement data for Ayayai Corporation are presented here. AYAYAI CORPORATION Balance Sheets December 31 2017 2016 2015 Cash $ 31,000 $ 21,000 $ 19,000 Accounts receivable (net) 51,000 46,000 49,000 Other current assets 92,000 97,000 66,000 Investments 57,000 72,000 47,000 Plant and equipment (net) 500,000 370,000 358,000 $731,000 $606,000 $539,000 Current liabilities $ 86,000 $ 81,000 $ 71,000 Long-term debt 147,000 87,000 52,000 Common stock, $10 par 322,000 312,000 302,000 Retained earnings 176,000 126,000 114,000...
how to get the numbers [2] Financial ratios (58 points) Find the missing values on the...
 how to get the numbers
[2] Financial ratios (58 points) Find the missing values on the balance sheet and the income statement of Pensacola Railroads (in S millions). Start with the balance sheet, and then continue with the income statement. You can use the following ratios: NOTE: USE AVERAGE RECEIVABLES AND INVENTORY Debt Ratio loterest Coverage Ratio CurreatRatio Quick Ratio Cash Ratio 0.4 1.4 0.2 Average Collection Period (average receivables) Tax rate 73 das 40% Marks: 28 for balance sheet,...
how to get the numbers
[2] Financial ratios (58 points) Find the missing values on the balance sheet and the income statement of Pensacola Railroads (in S millions). Start with the balance sheet, and then continue with the income statement. You can use the following ratios: NOTE: USE AVERAGE RECEIVABLES AND INVENTORY Debt Ratio loterest Coverage Ratio CurreatRatio Quick Ratio Cash Ratio 0.4 1.4 0.2 Average Collection Period (average receivables) Tax rate 73 das 40% Marks: 28 for balance sheet,...
The following information is available for Bridgeport Corp. Current assets 2017 2016 $ 70,000 $39,360 260,000...
 The following information is available for Bridgeport Corp. Current assets 2017 2016 $ 70,000 $39,360 260,000 230,000 Total assets Current liabilities 28,000 32,800 Total liabilities Net income Net cash provided by operating activities 91,000 74,875 90,000 4,000 3,000 23,000 105,800 32,500 56,000 4,000 1,500 16,000 Preferred dividends Common dividends Expenditures on property, plant, and equipment Shares outstanding at beginning of year 35,000 25,000 Shares outstanding at end of year 70,000 35,000 (a) Compute earnings per share for 2017 and 2016...
The following information is available for Monty Corp. 2017 2016 Current assets $ 48,300 $ 47,850...
 The following information is available for Monty Corp. 2017 2016 Current assets $ 48,300 $ 47,850 Total assets 280,000 240,000 Current liabilities 23,000 33,000 Total liabilities 89,600 112,800 Net income 110,250 40,000 Net cash provided by operating activities 90,000 56,000 Preferred dividends 4,000 4,000 Common dividends 2,000 1,000 Expenditures on property, plant, and equipment 28,000 15,000 Shares outstanding at beginning of year 45,000 35,000 Shares outstanding at end of year 80,000 45,000 (a) Compute earnings per share for 2017 and...
(a) Compute earnings per share for 2017 and 2016 for Blossom. (Round answers to 2 decimal...
 (a) Compute earnings per share for 2017 and 2016 for Blossom. (Round answers to 2 decimal places, e.g. 52.75.) 2017 2016 Earnings per share (b) Compute the current ratio and debt to assets ratio for each year. (Round answers to 2 decimal places, e.g. 15.25.) 2017 2016 Current ratio :1 :1 Debt to assets ratio % % (c) Compute free cash flow for each year. 2017 2016 Free cash flow $ Current Attempt in Progress The following information is available...
Problem 13-031 Condensed balance sheet and income statement data for Sheffield Corporation are presented here. ENT...
 Problem 13-031 Condensed balance sheet and income statement data for Sheffield Corporation are presented here. ENT ES ignment2 m 13-04A m 13-03 em 13-02A d Your Critical 13-04 ad Your Critical ng 13-03 Exercise 13-01 Exercise 13-02 Exercise 13-04 Exercise 13-05 Exercise 13-06 Exercise 13-02 Exercise 13-08 Level ission) SHEFFIELD CORPORATION Balance Sheets December 31 2022 2021 Cash $ 32,000 $ 22,000 Accounts receivable (net) 52,000 47,000 Other current assets 94,000 99,000 Investments 59,000 74,000 Plant and equipment (net) 500,000...
 Condensed balance sheet and income statement data for Wildhorse Co. are presented as follows. Wildhorse Co. Balance Sheets December 31 2017 2016 Assets Cash Receivables (net) Other current assets Long-term investments Property, plant, and equipment (net) Total assets Liabilities and Stockholders' Equity Current liabilities Long-term liabilities Common stock Retained earnings Total liabilities and stockholders' equity $ 32,660 82,400 102,400 62,000 522,400 $801,860 $24,660 74,400 85,400 60,000 482,400 726,860 $79,660 92,400 342,400 287,400 $ 801,860 $74,660 102,400 312,400 237,400 $726,860 Wildhorse...
 condensed balance sheet and income statement for wild horse Cole
are presented as follows compute these values and ratios for 2016
and 2017 round earnings per share to two decimal places
Homework Required Question 7 of 7 CUTTUCC vatani DIICCL CITU HLUTI DOLCIFICHE UaLa TU VYTUS UU. ar 2016 Wildhorse Co. Balance Sheets December 31 Assets Cash Receivables (net) Other current assets Long-term investments Property, plant, and equipment (net) Total assets Liabilities and Stockholders' Equity Current liabilities Long-term liabilities Common...
condensed balance sheet and income statement for wild horse Cole
are presented as follows compute these values and ratios for 2016
and 2017 round earnings per share to two decimal places
Homework Required Question 7 of 7 CUTTUCC vatani DIICCL CITU HLUTI DOLCIFICHE UaLa TU VYTUS UU. ar 2016 Wildhorse Co. Balance Sheets December 31 Assets Cash Receivables (net) Other current assets Long-term investments Property, plant, and equipment (net) Total assets Liabilities and Stockholders' Equity Current liabilities Long-term liabilities Common...
 [2] Financial ratios (58 points) Find the missing values on the balance sheet and the income statement of Pensacola Railroads (in S millions). Start with the balance sheet, and then continue with the income statement. You can use the following ratios: NOTE: USE AVERAGE RECEIVABLES AND INVENTORY Debt Ratio loterest Coverage Ratio CurreatRatio Quick Ratio Cash Ratio 0.4 1.4 0.2 Average Collection Period (average receivables) Tax rate 73 das 40% Marks: 28 for balance sheet, 30 for income statement. Balance...
 how to get the numbers
[2] Financial ratios (58 points) Find the missing values on the balance sheet and the income statement of Pensacola Railroads (in S millions). Start with the balance sheet, and then continue with the income statement. You can use the following ratios: NOTE: USE AVERAGE RECEIVABLES AND INVENTORY Debt Ratio loterest Coverage Ratio CurreatRatio Quick Ratio Cash Ratio 0.4 1.4 0.2 Average Collection Period (average receivables) Tax rate 73 das 40% Marks: 28 for balance sheet,...
how to get the numbers
[2] Financial ratios (58 points) Find the missing values on the balance sheet and the income statement of Pensacola Railroads (in S millions). Start with the balance sheet, and then continue with the income statement. You can use the following ratios: NOTE: USE AVERAGE RECEIVABLES AND INVENTORY Debt Ratio loterest Coverage Ratio CurreatRatio Quick Ratio Cash Ratio 0.4 1.4 0.2 Average Collection Period (average receivables) Tax rate 73 das 40% Marks: 28 for balance sheet,...
 The following information is available for Bridgeport Corp. Current assets 2017 2016 $ 70,000 $39,360 260,000 230,000 Total assets Current liabilities 28,000 32,800 Total liabilities Net income Net cash provided by operating activities 91,000 74,875 90,000 4,000 3,000 23,000 105,800 32,500 56,000 4,000 1,500 16,000 Preferred dividends Common dividends Expenditures on property, plant, and equipment Shares outstanding at beginning of year 35,000 25,000 Shares outstanding at end of year 70,000 35,000 (a) Compute earnings per share for 2017 and 2016...
 The following information is available for Monty Corp. 2017 2016 Current assets $ 48,300 $ 47,850 Total assets 280,000 240,000 Current liabilities 23,000 33,000 Total liabilities 89,600 112,800 Net income 110,250 40,000 Net cash provided by operating activities 90,000 56,000 Preferred dividends 4,000 4,000 Common dividends 2,000 1,000 Expenditures on property, plant, and equipment 28,000 15,000 Shares outstanding at beginning of year 45,000 35,000 Shares outstanding at end of year 80,000 45,000 (a) Compute earnings per share for 2017 and...
 (a) Compute earnings per share for 2017 and 2016 for Blossom. (Round answers to 2 decimal places, e.g. 52.75.) 2017 2016 Earnings per share (b) Compute the current ratio and debt to assets ratio for each year. (Round answers to 2 decimal places, e.g. 15.25.) 2017 2016 Current ratio :1 :1 Debt to assets ratio % % (c) Compute free cash flow for each year. 2017 2016 Free cash flow $ Current Attempt in Progress The following information is available...
 Problem 13-031 Condensed balance sheet and income statement data for Sheffield Corporation are presented here. ENT ES ignment2 m 13-04A m 13-03 em 13-02A d Your Critical 13-04 ad Your Critical ng 13-03 Exercise 13-01 Exercise 13-02 Exercise 13-04 Exercise 13-05 Exercise 13-06 Exercise 13-02 Exercise 13-08 Level ission) SHEFFIELD CORPORATION Balance Sheets December 31 2022 2021 Cash $ 32,000 $ 22,000 Accounts receivable (net) 52,000 47,000 Other current assets 94,000 99,000 Investments 59,000 74,000 Plant and equipment (net) 500,000...
Most questions answered within 3 hours.
-
Where is the error in this code sequence?
String s1 = "Hello";
String s2 = "ello";...
asked 10 months ago -
Financial data for Joel de Paris, Inc., for last year
follow:
Joel de Paris, Inc.
Balance...
asked 10 months ago -
Consider this reaction:
Al2(SO4)3 (aq)+ BaCl3
(aq) Al2Cl6 (aq)- +
3BaSO4(s) . What is the...
asked 10 months ago -
Suppose that Savneet is considering increasing her
recent random sample from 20 car rentals to 40...
asked 10 months ago -
Trucks arrive at an unloading terminal at an average rate of 120
per hour.
Trucks arrive...
asked 10 months ago -
Why are methanol and ethanol completely soluble in water while
octanol is not very little soluble....
asked 10 months ago -
A facilities manager at a university reads in a research report
that the mean amount of...
asked 10 months ago -
When the CuSO4 is rehydrated by adding water to the anhydrous
compound, is this an endothermic...
asked 10 months ago -
A ray of sunlight is passing from diamond into crown glass; the
angle of incidence is...
asked 10 months ago -
A block of mass 0.249 kg is placed on top of a light, vertical
spring of...
asked 10 months ago -
how do the kidneys compensate in the presences of acidosis
a) trigger hyperventilate
b) reserve acid...
asked 10 months ago -
Question 501 pts
The rental rate of capital to the firm increases. Which of the
following...
asked 10 months ago