1 Provide these returns, clearly labeled, along with the annualized versions of these returns. (find the annualized return) Note you
have daily return data, not weekly.
Homework Answers
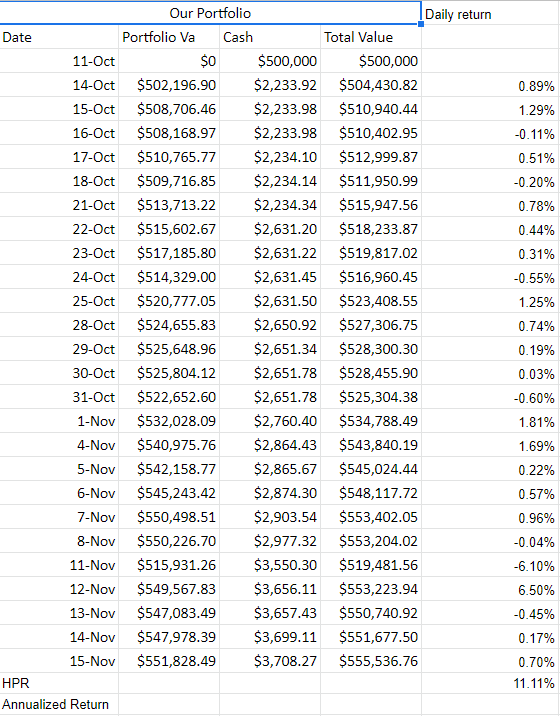
Given daily return in the question
Cumulative daily return is 11.11%
The requested is annualized return. So we have to divide with 365 as the year consists of 365days
So the answer is 11.11*365 = 162.206
Adjusted the decimals to the percentage 16.2206%
Add Answer to:
1 Provide these returns, clearly labeled, along with the
annualized versions of these returns. (find the...
Find five years of monthly returns for two mutual funds, Vanguard’s U.S. Growth Fund and U.S....
Find five years of monthly returns for two mutual funds, Vanguard’s U.S. Growth Fund and U.S. Value Fund, as well as corresponding returns for the S&P 500 and the Treasury-bill rate. (Use Spreadsheet.xls) a. Calculate each fund’s excess rate of return over T-bills in each month. (Negative values should be indicated by a minus sign. Leave no cells blank - be certain to enter "0" wherever required. Do not round intermediate calculations. Round your answers to 2 decimal places.) Total...
integrated mini-case: Disney’s Beta When you go on the web to find a firm’s beta, you...
 integrated mini-case: Disney’s Beta
When you go on the web to find a firm’s beta, you do not know
how recently it was computed, what index was used as a proxy for
the market portfolio, or which time series of returns the
calculations used. Earlier in this chapter, it was shown that when
we went on the Web to find a beta for Disney, we found the
following: MSN Money (1.29) and Yahoo! Finance (1.18). An
alternative is to compute...
integrated mini-case: Disney’s Beta
When you go on the web to find a firm’s beta, you do not know
how recently it was computed, what index was used as a proxy for
the market portfolio, or which time series of returns the
calculations used. Earlier in this chapter, it was shown that when
we went on the Web to find a beta for Disney, we found the
following: MSN Money (1.29) and Yahoo! Finance (1.18). An
alternative is to compute...
Use Table 8.1, a computer, or a calculator to answer the following. Suppose a candidate for...
 Use Table 8.1, a computer, or a calculator to answer the following. Suppose a candidate for public office is favored by only 47% of the voters. If a sample survey randomly selects 2,500 voters, the percentage in the sample who favor the candidate can be thought of as a measurement from a normal curve with a mean of 47% and a standard deviation of 1%. Based on this information, how often (as a %) would such a survey show that...
Suppose 1000 coins are tossed. Use the normal curve approximation to the binomial distribution to find...
 Suppose 1000 coins are tossed. Use the normal curve approximation to the binomial distribution to find the probability of getting the following result. Exactly 495 heads Use the table of areas under the standard normal curve given below. Click here to view page 1. Click here to view page 2. Click here to view page 3. Click here to view page 4. Click here to view page 5. Click here to view page 6. The probability of getting exactly 495...
Suppose 16 coins are tossed. Use the normal curve approximation to the binomial distribution to find...
 Suppose 16 coins are tossed. Use the normal curve approximation to the binomial distribution to find the probability of getting the following result. More than 11 tails. Use the table of areas under the standard normal curve given below. Click here to view page 1. Click here to view page 2. Click here to view page 3. Click here to view page 4. Click here to view page 5. Click here to view page 6. Binomial probability = (Round to...
Case Study Notes Case Questions 1- Is Disney liquid compared to its peers? 2- Does Disney...
 Case Study Notes
Case
Questions
1- Is Disney liquid compared to its peers?
2- Does Disney manage its assets effectively compared to its
peers?
3- Does Disney’s debt load suggest trouble paying its
creditors?
4- Compare Disney’s profitability to its peers.
21,922 36.5% 46.7% 24,701 41.1% 6,095 38.8% PECP Studio Entertainment 10,065 16.7% 19.1% 3,414 5.7% -738 -4.7% -668 -10 Eliminations Total 59,434 HOW DISNEY MAKES MONEY PARKS, EXPERIENCES & CONSUMER PRODUCTS A previous Disney Case used the company's financial...
Case Study Notes
Case
Questions
1- Is Disney liquid compared to its peers?
2- Does Disney manage its assets effectively compared to its
peers?
3- Does Disney’s debt load suggest trouble paying its
creditors?
4- Compare Disney’s profitability to its peers.
21,922 36.5% 46.7% 24,701 41.1% 6,095 38.8% PECP Studio Entertainment 10,065 16.7% 19.1% 3,414 5.7% -738 -4.7% -668 -10 Eliminations Total 59,434 HOW DISNEY MAKES MONEY PARKS, EXPERIENCES & CONSUMER PRODUCTS A previous Disney Case used the company's financial...
 integrated mini-case: Disney’s Beta
When you go on the web to find a firm’s beta, you do not know
how recently it was computed, what index was used as a proxy for
the market portfolio, or which time series of returns the
calculations used. Earlier in this chapter, it was shown that when
we went on the Web to find a beta for Disney, we found the
following: MSN Money (1.29) and Yahoo! Finance (1.18). An
alternative is to compute...
integrated mini-case: Disney’s Beta
When you go on the web to find a firm’s beta, you do not know
how recently it was computed, what index was used as a proxy for
the market portfolio, or which time series of returns the
calculations used. Earlier in this chapter, it was shown that when
we went on the Web to find a beta for Disney, we found the
following: MSN Money (1.29) and Yahoo! Finance (1.18). An
alternative is to compute...
 Use Table 8.1, a computer, or a calculator to answer the following. Suppose a candidate for public office is favored by only 47% of the voters. If a sample survey randomly selects 2,500 voters, the percentage in the sample who favor the candidate can be thought of as a measurement from a normal curve with a mean of 47% and a standard deviation of 1%. Based on this information, how often (as a %) would such a survey show that...
 Suppose 1000 coins are tossed. Use the normal curve approximation to the binomial distribution to find the probability of getting the following result. Exactly 495 heads Use the table of areas under the standard normal curve given below. Click here to view page 1. Click here to view page 2. Click here to view page 3. Click here to view page 4. Click here to view page 5. Click here to view page 6. The probability of getting exactly 495...
 Suppose 16 coins are tossed. Use the normal curve approximation to the binomial distribution to find the probability of getting the following result. More than 11 tails. Use the table of areas under the standard normal curve given below. Click here to view page 1. Click here to view page 2. Click here to view page 3. Click here to view page 4. Click here to view page 5. Click here to view page 6. Binomial probability = (Round to...
 Case Study Notes
Case
Questions
1- Is Disney liquid compared to its peers?
2- Does Disney manage its assets effectively compared to its
peers?
3- Does Disney’s debt load suggest trouble paying its
creditors?
4- Compare Disney’s profitability to its peers.
21,922 36.5% 46.7% 24,701 41.1% 6,095 38.8% PECP Studio Entertainment 10,065 16.7% 19.1% 3,414 5.7% -738 -4.7% -668 -10 Eliminations Total 59,434 HOW DISNEY MAKES MONEY PARKS, EXPERIENCES & CONSUMER PRODUCTS A previous Disney Case used the company's financial...
Case Study Notes
Case
Questions
1- Is Disney liquid compared to its peers?
2- Does Disney manage its assets effectively compared to its
peers?
3- Does Disney’s debt load suggest trouble paying its
creditors?
4- Compare Disney’s profitability to its peers.
21,922 36.5% 46.7% 24,701 41.1% 6,095 38.8% PECP Studio Entertainment 10,065 16.7% 19.1% 3,414 5.7% -738 -4.7% -668 -10 Eliminations Total 59,434 HOW DISNEY MAKES MONEY PARKS, EXPERIENCES & CONSUMER PRODUCTS A previous Disney Case used the company's financial...
Most questions answered within 3 hours.
-
Where is the error in this code sequence?
String s1 = "Hello";
String s2 = "ello";...
asked 10 months ago -
Financial data for Joel de Paris, Inc., for last year
follow:
Joel de Paris, Inc.
Balance...
asked 10 months ago -
Consider this reaction:
Al2(SO4)3 (aq)+ BaCl3
(aq) Al2Cl6 (aq)- +
3BaSO4(s) . What is the...
asked 10 months ago -
Suppose that Savneet is considering increasing her
recent random sample from 20 car rentals to 40...
asked 10 months ago -
Trucks arrive at an unloading terminal at an average rate of 120
per hour.
Trucks arrive...
asked 10 months ago -
Why are methanol and ethanol completely soluble in water while
octanol is not very little soluble....
asked 10 months ago -
A facilities manager at a university reads in a research report
that the mean amount of...
asked 10 months ago -
When the CuSO4 is rehydrated by adding water to the anhydrous
compound, is this an endothermic...
asked 10 months ago -
A ray of sunlight is passing from diamond into crown glass; the
angle of incidence is...
asked 10 months ago -
A block of mass 0.249 kg is placed on top of a light, vertical
spring of...
asked 10 months ago -
how do the kidneys compensate in the presences of acidosis
a) trigger hyperventilate
b) reserve acid...
asked 10 months ago -
Question 501 pts
The rental rate of capital to the firm increases. Which of the
following...
asked 10 months ago