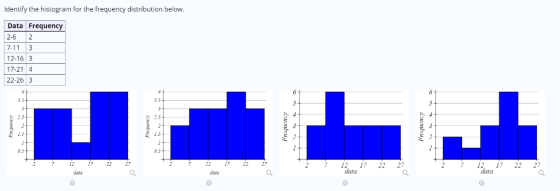
Identify the histogram for the frequency distribution below.
| Data | Frequency |
| 2-6 | 2 |
| 7-11 | 3 |
| 12-16 | 3 |
| 17-21 | 4 |
| 22-26 | 3 |
Homework Answers

Add Answer to:
Identify the histogram for the frequency distribution below.
Data
Frequency
2-6
2
7-11
3
12-16
3...
6) Draw a histogram for the frequency distribution in #5: or questions #7 – 10, use...
 6) Draw a histogram for the frequency distribution in #5: or questions #7 – 10, use the data below: 15 8 27 10 23 14 7 13 12 8 10 9 15 17 6 14 11 18 14 25 7) Construct a grouped frequency distribution for the data above.
Use the given data to construct a frequency distribution. 11) The number of people treated in...
Use the given data to construct a frequency distribution. 11) The number of people treated in the emergency service of a hospital every day of November was 15 23 12 10 28 7 12 17 20 21 18 13 11 12 26 6 16 19 22 14 17 21 28 9 16 13 11 16 20
7. Construct one table that includes relative frequencies based on the frequency distributions shown below, then...
7. Construct one table that includes relative frequencies based on the frequency distributions shown below, then compare the amounts of tar in nonfiltered and filtered cigarettes. Do the cigarette filters appear to be effective? (Hint: The filters reduce the amount of tar ingested by the smoker.) Complete the relative frequency table below. Tar (mg) Relative Frequency (Nonfiltered) Relative Frequency (Filtered) 2- 6 % % 7-11 % % 12- 16 % % 17- 21 % % 22- 26 % % 27-...
Example (H.W): You have the following data: 8 6 11 14 10 11 9 7 2...
Example (H.W): You have the following data: 8 6 11 14 10 11 9 7 2 8 9 5 5 5 12 7 8 4 17 8 12 7 8 8 7 10 8 6 9 9 11 16 2 7 4 8 4 4 5 5 9 9 6 6 7 7 9 5 4 5 14 2 9 0 6 1 1 12 11 4 1. Construct a frequency distribution for these data. 2. Develop a relative frequency...
1. Given the following data: years 0-9 10-19 20-29 frequency 4 6 8 a. Identify lower...
 1. Given the following data: years 0-9 10-19 20-29 frequency 4 6 8 a. Identify lower class limits b. Identify upper class limits c. Identify the class boundaries 2. Given the following data: Cigarette CO (mg) Frequency 2-6 7-11 2 12-16 6 17-21 8 a. Identify the class width b. Identify the class midpoints c. Does the frequency distribution appear to have a normal distribution? 3. Histogram Cigarette Tar Frequency Table Tar (mg) Freq. 2-5 6-9 2 10-13 6 14-17...
please explain 1-3 in detail, thank you! all data below Paragraph Histogram of height Styles 10...
 please explain 1-3 in detail, thank you! all data below
Paragraph Histogram of height Styles 10 Frequency 10 10 170 height 1. describe the histogram using the four characteristics: shape, center, variability(spread) and outliers. Use full sentences for the description. 2. Define the parameter being estimated in this histogram. 3. State and check the assumptions for the 95% confidence interval for the population mean. Make sure to explain why the assumptions are met or not. A check mark is not...
please explain 1-3 in detail, thank you! all data below
Paragraph Histogram of height Styles 10 Frequency 10 10 170 height 1. describe the histogram using the four characteristics: shape, center, variability(spread) and outliers. Use full sentences for the description. 2. Define the parameter being estimated in this histogram. 3. State and check the assumptions for the 95% confidence interval for the population mean. Make sure to explain why the assumptions are met or not. A check mark is not...
Consider the data in the following frequency distribution. Assume the data represent a sample. Class Frequency...
Consider the data in the following frequency distribution. Assume the data represent a sample. Class Frequency 12-16 12 17-21 23 22-26 14 27-31 21 What is the variance?
13 12 11 10 8 6 7 P 5 P 4 3 r 1 2 MarvelUS...
 13 12 11 10 8 6 7 P 5 P 4 3 r 1 2 MarvelUS is a service that streams shows and movies over the internet. As a new subscriber, Gary counted the number of episodes that are available through the service for a selection of his favorite shows. The histogram below summarizes the data. Use the histogram to answer each of the questions. (a) How many shows have from 11 to 16 episodes available? Frequency (Number of shows)...
frequency table histogram frequency polygon ogive 100% (?) New Open Save Print Import Copy Paste Format...
 frequency table histogram frequency polygon
ogive
100% (?) New Open Save Print Import Copy Paste Format Undo Redo AutoSum Sort A-Z Sort Z-A Gallery Toolbox Zoom Help Charts SmartArt Gr Word Protein Grams In Fast Food 223 3 25 12 38 22 21 427 27 1429 27 42 34 35 23 12 27 29 15 31 6 30 7 15 57 35 9 35 10 20 11 18 12 24 20 26 19 35 Tasks 1. Complete the fequency table...
frequency table histogram frequency polygon
ogive
100% (?) New Open Save Print Import Copy Paste Format Undo Redo AutoSum Sort A-Z Sort Z-A Gallery Toolbox Zoom Help Charts SmartArt Gr Word Protein Grams In Fast Food 223 3 25 12 38 22 21 427 27 1429 27 42 34 35 23 12 27 29 15 31 6 30 7 15 57 35 9 35 10 20 11 18 12 24 20 26 19 35 Tasks 1. Complete the fequency table...
 6) Draw a histogram for the frequency distribution in #5: or questions #7 – 10, use the data below: 15 8 27 10 23 14 7 13 12 8 10 9 15 17 6 14 11 18 14 25 7) Construct a grouped frequency distribution for the data above.
 1. Given the following data: years 0-9 10-19 20-29 frequency 4 6 8 a. Identify lower class limits b. Identify upper class limits c. Identify the class boundaries 2. Given the following data: Cigarette CO (mg) Frequency 2-6 7-11 2 12-16 6 17-21 8 a. Identify the class width b. Identify the class midpoints c. Does the frequency distribution appear to have a normal distribution? 3. Histogram Cigarette Tar Frequency Table Tar (mg) Freq. 2-5 6-9 2 10-13 6 14-17...
 please explain 1-3 in detail, thank you! all data below
Paragraph Histogram of height Styles 10 Frequency 10 10 170 height 1. describe the histogram using the four characteristics: shape, center, variability(spread) and outliers. Use full sentences for the description. 2. Define the parameter being estimated in this histogram. 3. State and check the assumptions for the 95% confidence interval for the population mean. Make sure to explain why the assumptions are met or not. A check mark is not...
please explain 1-3 in detail, thank you! all data below
Paragraph Histogram of height Styles 10 Frequency 10 10 170 height 1. describe the histogram using the four characteristics: shape, center, variability(spread) and outliers. Use full sentences for the description. 2. Define the parameter being estimated in this histogram. 3. State and check the assumptions for the 95% confidence interval for the population mean. Make sure to explain why the assumptions are met or not. A check mark is not...
 13 12 11 10 8 6 7 P 5 P 4 3 r 1 2 MarvelUS is a service that streams shows and movies over the internet. As a new subscriber, Gary counted the number of episodes that are available through the service for a selection of his favorite shows. The histogram below summarizes the data. Use the histogram to answer each of the questions. (a) How many shows have from 11 to 16 episodes available? Frequency (Number of shows)...
 frequency table histogram frequency polygon
ogive
100% (?) New Open Save Print Import Copy Paste Format Undo Redo AutoSum Sort A-Z Sort Z-A Gallery Toolbox Zoom Help Charts SmartArt Gr Word Protein Grams In Fast Food 223 3 25 12 38 22 21 427 27 1429 27 42 34 35 23 12 27 29 15 31 6 30 7 15 57 35 9 35 10 20 11 18 12 24 20 26 19 35 Tasks 1. Complete the fequency table...
frequency table histogram frequency polygon
ogive
100% (?) New Open Save Print Import Copy Paste Format Undo Redo AutoSum Sort A-Z Sort Z-A Gallery Toolbox Zoom Help Charts SmartArt Gr Word Protein Grams In Fast Food 223 3 25 12 38 22 21 427 27 1429 27 42 34 35 23 12 27 29 15 31 6 30 7 15 57 35 9 35 10 20 11 18 12 24 20 26 19 35 Tasks 1. Complete the fequency table...
Most questions answered within 3 hours.
-
Where is the error in this code sequence?
String s1 = "Hello";
String s2 = "ello";...
asked 10 months ago -
Financial data for Joel de Paris, Inc., for last year
follow:
Joel de Paris, Inc.
Balance...
asked 10 months ago -
Consider this reaction:
Al2(SO4)3 (aq)+ BaCl3
(aq) Al2Cl6 (aq)- +
3BaSO4(s) . What is the...
asked 10 months ago -
Suppose that Savneet is considering increasing her
recent random sample from 20 car rentals to 40...
asked 10 months ago -
Trucks arrive at an unloading terminal at an average rate of 120
per hour.
Trucks arrive...
asked 10 months ago -
Why are methanol and ethanol completely soluble in water while
octanol is not very little soluble....
asked 10 months ago -
A facilities manager at a university reads in a research report
that the mean amount of...
asked 10 months ago -
When the CuSO4 is rehydrated by adding water to the anhydrous
compound, is this an endothermic...
asked 10 months ago -
A ray of sunlight is passing from diamond into crown glass; the
angle of incidence is...
asked 10 months ago -
A block of mass 0.249 kg is placed on top of a light, vertical
spring of...
asked 10 months ago -
how do the kidneys compensate in the presences of acidosis
a) trigger hyperventilate
b) reserve acid...
asked 10 months ago -
Question 501 pts
The rental rate of capital to the firm increases. Which of the
following...
asked 10 months ago