
Homework Answers


Add Answer to:
Consider
the following table which shows different
baskets of tennis balls:
(a) List all samples of...
Consider the following table which shows different baskets of tennis balls: Baskets Number of golf balls...
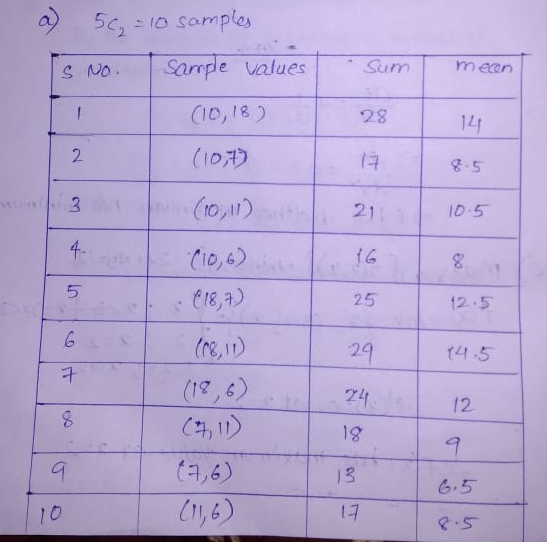
Consider the following table which shows different baskets of tennis balls: Baskets Number of golf balls (Population) 1 10 2 18 3 7 4 11 5 6 (a) List all samples of size 2, and compute the mean of each sample. (b) Compute the mean of the distribution of the sample mean and the population mean. Compare the two values. (c) Compare the dispersion in the population with that of the sample mean.
1. Consider the following table which shows different baskets of tennis balls: Number of golf balls...
 1. Consider the following table which shows different baskets of tennis balls: Number of golf balls Baskets (Population) 10 18 7 2 4 6 (a) List all samples of size 2, and compute the mean of each sample (b) Compute the mean of the distribution of the sample mean and the population mean. Compare the two values. (c) Compare the dispersion in the population with that of the sample mean.
1. Consider the following table which shows different baskets of tennis balls: Baskets Number of golf...
1. Consider the following table which shows different baskets of tennis balls: Baskets Number of golf balls (Population) 1 10 2 18 3 7 4 11 5 6 (a) List all samples of size 2, and compute the mean of each sample. (b) Compute the mean of the distribution of the sample mean and the population mean. Compare the two values. (c) Compare the dispersion in the population with that of the sample mean.
A population consists of the following fives values: 14, 15, 16, 18, 22. a. List all...
A population consists of the following fives values: 14, 15, 16, 18, 22. a. List all samples of size 3, and compute the mean of each sample. b. Compute the mean of the distribution of sample means and the population mean. Compare the two values. c. Compare the dispersion in the population with that of the sample means. Show your answer in the form of an Excel table.
A population consists of the following five values: 18, 18, 8, 24, 16. a. Not available...
A population consists of the following five values: 18, 18, 8, 24, 16. a. Not available in Connect. b. By listing all samples of size 3, compute the mean of the distribution of the sample mean and the population mean. Compare the two values. (Round the final answer to the nearest whole number.) Sample means Population mean Both means are (Click to select) equal not equal c. Compare the dispersion in the population with that of the sample means. Hint:...
A population consists of the following five values: 10, 14, 16, 18, and 19. a. List...
 A population consists of the following five values: 10, 14, 16, 18, and 19. a. List all samples of size 3, and compute the mean of each sample. (Round your mean value to 2 decimal places.) Sample Sum Mean 1 2 3 4 Values 10,14,16 10,14,18 10,14,19 10,16,18 10,16,19 14,16,18 14,16,19 16,18,19 5 6 7 00 9 10 b. Compute the mean of the distribution of sample means and the population mean. Compare the two values. (Round your answers to...
A population consists of the following five values: 6, 6, 24, 31, 32. a. Not available...
A population consists of the following five values: 6, 6, 24, 31, 32. a. Not available in Connect. b. By listing all samples of size 3, compute the mean of the distribution of the sample mean and the population mean. Compare the two values. (Round the final answer to the nearest whole number.) Sample means Population mean Both means are (Click to select) equal not equal c. Compare the dispersion in the population with that of the sample means. Hint:...
For the following situation, find the mean and standard deviation of the population. List all samples(with...
For the following situation, find the mean and standard deviation of the population. List all samples(with replacement) of the given size from that population. Find the mean and standard deviation of the sampling distribution and compare them with the mean and standard deviation of the population. The number of DVDs rented by each of three families in the past month is 6,11,and 4. Use a sample size of 2. The mean of the population is? The standard deviation of the...
Seved Help Save 2 A population consists of the following five values: 10, 12, 16, 18,...
 Seved Help Save 2 A population consists of the following five values: 10, 12, 16, 18, and 20. a. List all samples of size 3, and compute the mean of each sample. (Round your mean value to 2 decimal places.) 20 points Sample Valuos Sum Mean eBook 1 Ask 2 Print 4 References 6 7 10 b. Compute the mean of the distribution of sample means and the population mean. Compare the two values. (Round your answers to 2 decimal...
List all possible samples of size n=3, with replacement, from the population (1,3,5). Calculate the mean...
List all possible samples of size n=3, with replacement, from the population (1,3,5). Calculate the mean of each sample. Construct a probability distribution of the sample means and compute the mean, variance, and standard deviation of the sample means and compare to the mean, variance, and standard deviation of the population.
 1. Consider the following table which shows different baskets of tennis balls: Number of golf balls Baskets (Population) 10 18 7 2 4 6 (a) List all samples of size 2, and compute the mean of each sample (b) Compute the mean of the distribution of the sample mean and the population mean. Compare the two values. (c) Compare the dispersion in the population with that of the sample mean.
 A population consists of the following five values: 10, 14, 16, 18, and 19. a. List all samples of size 3, and compute the mean of each sample. (Round your mean value to 2 decimal places.) Sample Sum Mean 1 2 3 4 Values 10,14,16 10,14,18 10,14,19 10,16,18 10,16,19 14,16,18 14,16,19 16,18,19 5 6 7 00 9 10 b. Compute the mean of the distribution of sample means and the population mean. Compare the two values. (Round your answers to...
 Seved Help Save 2 A population consists of the following five values: 10, 12, 16, 18, and 20. a. List all samples of size 3, and compute the mean of each sample. (Round your mean value to 2 decimal places.) 20 points Sample Valuos Sum Mean eBook 1 Ask 2 Print 4 References 6 7 10 b. Compute the mean of the distribution of sample means and the population mean. Compare the two values. (Round your answers to 2 decimal...
Most questions answered within 3 hours.
-
Where is the error in this code sequence?
String s1 = "Hello";
String s2 = "ello";...
asked 10 months ago -
Financial data for Joel de Paris, Inc., for last year
follow:
Joel de Paris, Inc.
Balance...
asked 10 months ago -
Consider this reaction:
Al2(SO4)3 (aq)+ BaCl3
(aq) Al2Cl6 (aq)- +
3BaSO4(s) . What is the...
asked 10 months ago -
Suppose that Savneet is considering increasing her
recent random sample from 20 car rentals to 40...
asked 10 months ago -
Trucks arrive at an unloading terminal at an average rate of 120
per hour.
Trucks arrive...
asked 10 months ago -
Why are methanol and ethanol completely soluble in water while
octanol is not very little soluble....
asked 10 months ago -
A facilities manager at a university reads in a research report
that the mean amount of...
asked 10 months ago -
When the CuSO4 is rehydrated by adding water to the anhydrous
compound, is this an endothermic...
asked 10 months ago -
A ray of sunlight is passing from diamond into crown glass; the
angle of incidence is...
asked 10 months ago -
A block of mass 0.249 kg is placed on top of a light, vertical
spring of...
asked 10 months ago -
how do the kidneys compensate in the presences of acidosis
a) trigger hyperventilate
b) reserve acid...
asked 10 months ago -
Question 501 pts
The rental rate of capital to the firm increases. Which of the
following...
asked 10 months ago