Determine the acceleration v. time and position v. time graphs
from the given velocity v. time graphs. 
Homework Answers
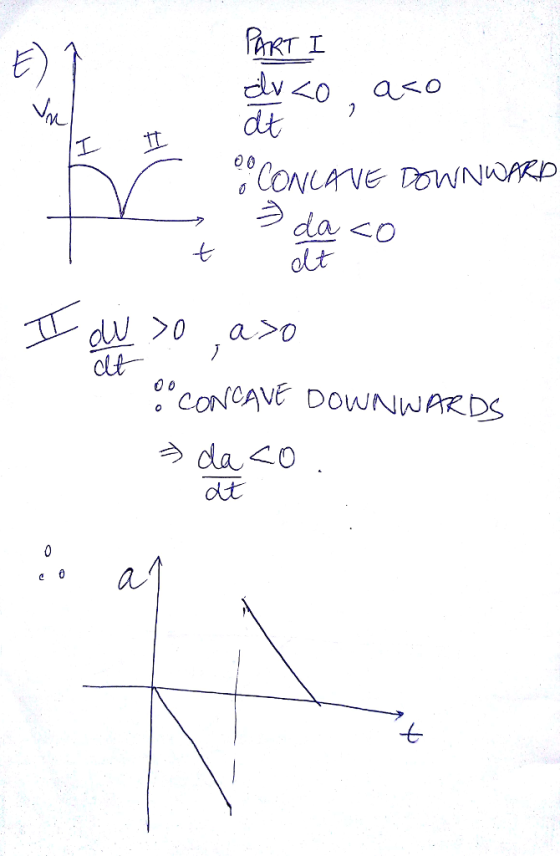
In order to interpret these VT graphs into at graphs we find the slopes of the curve and check its concavity and convexity.
Since, we know that dv/dt=a and d2v/dt2= da/dt we can use these facts to determine the slope and sign of the acceleration time graph.
The concavity of the graph tells us if d2v/dt2 is positive or negative. I e. If
Concave upwards then it is positive else if concave downwards then it is negative. Using these facts the corresponding graphs have been determined below as mentioned-


Add Answer to:
Determine the acceleration v. time and position v. time graphs
from the given velocity v. time...
For each of the given velocity vs time graphs, draw the corresponding acceleration vs time graph...
 For each of the given velocity
vs time graphs, draw the corresponding acceleration vs time
graph
七 七 →七
For each of the given velocity
vs time graphs, draw the corresponding acceleration vs time
graph
七 七 →七
For each of the given velocity vs time graphs, draw the corresponding position vs time graph...
 For each of the given velocity vs time graphs, draw the
corresponding position vs time graph
七 七 →七
For each of the given velocity vs time graphs, draw the
corresponding position vs time graph
七 七 →七
Shown below are various position-time, velocity-time and acceleration-time graphs. All of the graphs have numbered points...
 Shown
below are various position-time, velocity-time and
acceleration-time graphs. All of the graphs have numbered points on
them. For these questions include only those points where the sign
of the quantity definitely has the value specified. Include all
points that apply in each case, if there are none specify none.
Shown below are various position--time, velocity--time and acceleration--time graphs. All of the graphs have numbered points on them. Answer the questions below about the numbered points. For these questions include...
Shown
below are various position-time, velocity-time and
acceleration-time graphs. All of the graphs have numbered points on
them. For these questions include only those points where the sign
of the quantity definitely has the value specified. Include all
points that apply in each case, if there are none specify none.
Shown below are various position--time, velocity--time and acceleration--time graphs. All of the graphs have numbered points on them. Answer the questions below about the numbered points. For these questions include...
Predict and construct the position, velocity, and acceleration vs. time graphs for a ball tossed in...
Predict and construct the position, velocity, and acceleration vs. time graphs for a ball tossed in the air
the position, velocity and acceleration graphs for an object in freefall (no air resistance) if it...
 the position, velocity and acceleration graphs for an object in freefall (no air resistance) if it starts at 10 m high and thrown straight up with a velocity of 8.0 m/s Make sure the graphs are to scale and the time scale is the same for all three graphs Put a few numbers on each vertical axis and on the time axis. (Use g 10 m/s?) 1. Draw y(m) t(s) v(m/s) t(s) a(m/s') t(s)
The acceleration of particle is given as a function of velocity, a(v), find the position as...
The acceleration of particle is given as a function of velocity, a(v), find the position as a function of velocity, v(s)
For each of the velocity vs. time graphs below, sketch possible corresponding position vs. time and...
 For each of the velocity vs. time graphs below, sketch possible
corresponding position vs. time and acceleration vs. time graphs.
To the right of the graph, briefly describe the motion of the
object and why the graphs you drew are consistent with the velocity
graph. Where is the object at time t = 0 in each case?
Explain.
For each of the velocity vs. time graphs below, sketch possible
corresponding position vs. time and acceleration vs. time graphs.
To the right of the graph, briefly describe the motion of the
object and why the graphs you drew are consistent with the velocity
graph. Where is the object at time t = 0 in each case?
Explain.
11. Figure below shows hypothetical velocity-time graphs. Sketch qualitatively the corresponding acceleration-time graph. v (m/s) v...
 11. Figure below shows hypothetical velocity-time graphs. Sketch qualitatively the corresponding acceleration-time graph. v (m/s) v (m/s) *tis) (511 Case(i) Case(i)
Problem 9 For the following described motion, draw a position-time, a velocity-time, and an acceleration-time graph...
Problem 9 For the following described motion, draw a position-time, a velocity-time, and an acceleration-time graph on the grids provided: 1. Standing still at the 0.6 meter position for 1 second. 2. Walking away from the detector speeding up slowly and steadily for 2 seconds, going from rest to 1.0 m/s, at x=1.6 m. 3. Walking away from the detector steadily at 1.0 m/s for 2 seconds. 4. Coming to rest slowly and steadily over a 1 second period. 5....
Starting from s = 0 with no initial velocity, a particle is given an acceleration a(v)...
Starting from s = 0 with no initial velocity, a particle is given an acceleration a(v) = 0.13(v2+13)1/2, where a and v are expressed in m/s2 and m/s, respectively. Determine the position of the particle when v= 2 m/s,
 For each of the given velocity
vs time graphs, draw the corresponding acceleration vs time
graph
七 七 →七
For each of the given velocity
vs time graphs, draw the corresponding acceleration vs time
graph
七 七 →七
 For each of the given velocity vs time graphs, draw the
corresponding position vs time graph
七 七 →七
For each of the given velocity vs time graphs, draw the
corresponding position vs time graph
七 七 →七
 Shown
below are various position-time, velocity-time and
acceleration-time graphs. All of the graphs have numbered points on
them. For these questions include only those points where the sign
of the quantity definitely has the value specified. Include all
points that apply in each case, if there are none specify none.
Shown below are various position--time, velocity--time and acceleration--time graphs. All of the graphs have numbered points on them. Answer the questions below about the numbered points. For these questions include...
Shown
below are various position-time, velocity-time and
acceleration-time graphs. All of the graphs have numbered points on
them. For these questions include only those points where the sign
of the quantity definitely has the value specified. Include all
points that apply in each case, if there are none specify none.
Shown below are various position--time, velocity--time and acceleration--time graphs. All of the graphs have numbered points on them. Answer the questions below about the numbered points. For these questions include...
 the position, velocity and acceleration graphs for an object in freefall (no air resistance) if it starts at 10 m high and thrown straight up with a velocity of 8.0 m/s Make sure the graphs are to scale and the time scale is the same for all three graphs Put a few numbers on each vertical axis and on the time axis. (Use g 10 m/s?) 1. Draw y(m) t(s) v(m/s) t(s) a(m/s') t(s)
 For each of the velocity vs. time graphs below, sketch possible
corresponding position vs. time and acceleration vs. time graphs.
To the right of the graph, briefly describe the motion of the
object and why the graphs you drew are consistent with the velocity
graph. Where is the object at time t = 0 in each case?
Explain.
For each of the velocity vs. time graphs below, sketch possible
corresponding position vs. time and acceleration vs. time graphs.
To the right of the graph, briefly describe the motion of the
object and why the graphs you drew are consistent with the velocity
graph. Where is the object at time t = 0 in each case?
Explain.
 11. Figure below shows hypothetical velocity-time graphs. Sketch qualitatively the corresponding acceleration-time graph. v (m/s) v (m/s) *tis) (511 Case(i) Case(i)
Most questions answered within 3 hours.
-
Where is the error in this code sequence?
String s1 = "Hello";
String s2 = "ello";...
asked 10 months ago -
Financial data for Joel de Paris, Inc., for last year
follow:
Joel de Paris, Inc.
Balance...
asked 10 months ago -
Consider this reaction:
Al2(SO4)3 (aq)+ BaCl3
(aq) Al2Cl6 (aq)- +
3BaSO4(s) . What is the...
asked 10 months ago -
Suppose that Savneet is considering increasing her
recent random sample from 20 car rentals to 40...
asked 10 months ago -
Trucks arrive at an unloading terminal at an average rate of 120
per hour.
Trucks arrive...
asked 10 months ago -
Why are methanol and ethanol completely soluble in water while
octanol is not very little soluble....
asked 10 months ago -
A facilities manager at a university reads in a research report
that the mean amount of...
asked 10 months ago -
When the CuSO4 is rehydrated by adding water to the anhydrous
compound, is this an endothermic...
asked 10 months ago -
A ray of sunlight is passing from diamond into crown glass; the
angle of incidence is...
asked 10 months ago -
A block of mass 0.249 kg is placed on top of a light, vertical
spring of...
asked 10 months ago -
how do the kidneys compensate in the presences of acidosis
a) trigger hyperventilate
b) reserve acid...
asked 10 months ago -
Question 501 pts
The rental rate of capital to the firm increases. Which of the
following...
asked 10 months ago