Suppose the following data reflect the production possibilities for providing health care and education, graph the...
Suppose the following data reflect the production possibilities for providing health care and education, graph the PPC and answer two questions about production possibilities and opportunity cost.
a. Graph the production possibilities curve.
| Healthcare | Education |
| 400 | 0 |
| 370 | 20 |
| 330 | 40 |
| 270 | 50 |
| 190 | 60 |
| 100 | 70 |
| 0 | 80 |
|
|||||||||||||||||||||||||||||||||||||||||||||||||||||||||||||
Homework Answers
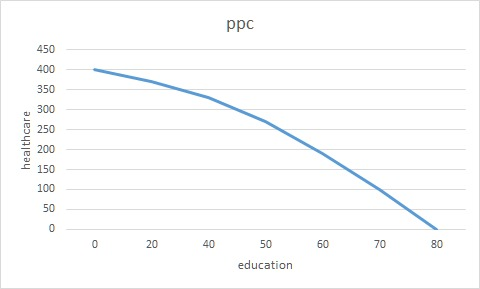
b) if healthcare is at maximum at 400 unit of education is zero
c) increase in health from 190 to 270 will make opportunity cost of education will be 10 units
Add Answer to:
Suppose the following data reflect the production possibilities
for providing health care and education, graph the...
Understanding Production Possibilities Using the following table for a hypothetical economy plot your data on a...
 Understanding Production Possibilities Using the following table for a hypothetical economy plot your data on a graph. Military 110 5 10s o 95 15 80 Consumer 0 60 40 35 50 10 20 60 Suppose the Economy is operating at point B. What is the opportunity cost of 10 additional units of consumer goods? Between which points is the opportunity cost of b producing consumer goods at maximum? A combination of 70 units of military goods and 45 units of...
A production possibilities table for DVDs and computers is shown below Production Alternatives Type of Production...
 A production possibilities table for DVDs and computers is shown below Production Alternatives Type of Production A Computers DVDs 0 20 40 60 80 80 70 35 a. Show these data graphically, and then identify a point that indicates an inefficient use of resources and a point that indicates an unattainable combination of goods Instructions: Use the tool provided 'PPC to draw a PPC curve (plot 5 points total) b. Does the economy above demonstrate the law of increasing opportunity cost?
Complete the Following Table: Units of Health Care Units of Education Marginal Cost of Health Care...
 Complete the Following Table: Units of Health Care Units of Education Marginal Cost of Health Care Production 0 units 160 I Total Cost of 1 units 135 M C) = value of the education for one units of TC = value of the units of education forepone 2 units 115 units of writer units MC MC, - value of the value of the education foregone TC -value of the of education foregone 3 units 105 units of MC- value of...
In the accompanying graph construct a production possibilities curve for a nation with the following maximum...
 In the accompanying graph construct a production possibilities curve for a nation with the following maximum output combinations. The Production Possibilities Curve Food ideo Games 0 10 10 16 19 1.) Using the point drawing tool, plot the four output combinations from the table above. Properly label each point. 2.) Using the 4-point curved Nne drewing tool, draw a curve connecting these points. Label this curve Carefuly towow the instructions above, and only draw the required abjects The shape of...
. Production Possibilities Frontier: Graph the following data on a production possibilities frontier curve. Scenario Beds...
. Production Possibilities Frontier: Graph the following data on a production possibilities frontier curve. Scenario Beds Sofas A 0 75 B 10 72 C 20 67 D 30 58 E 40 46 F 50 28 G 60 0 a. What is the opportunity cost of increasing the production of beds from 30 to 40? b. What would be happening if the firm were producing 40 beds and 40 sofas? d. What would you say about a combination of 30 sofas...
ECON 2303 HW I SP 20 A production possibilities table for bananas and apples is shown...
 ECON 2303 HW I SP 20 A production possibilities table for bananas and apples is shown below. Type of Production Bananas (in pounds) Apples (in pounds) A 0 100 Production Alternatives B C D 20 40 60 75 50 25 E 80 0 a. Show these data graphically. Instructions: Use the tool provided PPC to draw a PPC curve (plot 5 points total). Apples (in pounds) 0 80 100 20 40 60 Bananas (in pounds) b. Does the economy above...
1- Homewórk Saved A production possibilities table for DVDs and computers is shown below. Production Alternatives...
 1- Homewórk Saved A production possibilities table for DVDs and computers is shown below. Production Alternatives Type of Production A Computers DVDs 20 40 60 55 35 2 80 80 esa. Show these data graphically. Instructions: Use the tool provided 'PPC' to draw a PPC curve (plot 5 points total). Tools 100 90 80 70 PPC Computers b. What is the opportunity cost of the first 20 computers? (Cick to select c. Between which two consecutive points along the PPC...
A production possibilities table for DVDs and computers is shown below. Point (Click to select) G F D B C A is an example...
 A production possibilities table for DVDs and computers is shown
below.
Point (Click to
select) G F D B C A is
an example of an inefficient point, while (Click to
select) G B A D F C is
an example of an unattainable point.
b. Does the economy above demonstrate the law of increasing
opportunity cost?
(Click to
select) Yes No
Production Alternatives Type of Production A Computers DVDs 20 60 80 80 70 35 a. Show these data graphically, and then identify a point that indicates an inefficient use of resources and a point that indicates...
A production possibilities table for DVDs and computers is shown
below.
Point (Click to
select) G F D B C A is
an example of an inefficient point, while (Click to
select) G B A D F C is
an example of an unattainable point.
b. Does the economy above demonstrate the law of increasing
opportunity cost?
(Click to
select) Yes No
Production Alternatives Type of Production A Computers DVDs 20 60 80 80 70 35 a. Show these data graphically, and then identify a point that indicates an inefficient use of resources and a point that indicates...
urgent please Production Possibilities Analysis The table below is a set of hypothetical production possibilities for...
 urgent please
Production Possibilities Analysis The table below is a set of hypothetical production possibilities for a nation. . Automobiles Beef Combination (thousands) (thousands of tons) 10 4 0 9-4 10 a. Plot these production possibilities data. What is. the opportunity cost of the first 2,000 automobiles produced? Between which points is the oppor- tunity cost per thousand automobiles highest? Between which points is the opportunity cost per thousand tons of beef highest? b. Label a point P inside the...
urgent please
Production Possibilities Analysis The table below is a set of hypothetical production possibilities for a nation. . Automobiles Beef Combination (thousands) (thousands of tons) 10 4 0 9-4 10 a. Plot these production possibilities data. What is. the opportunity cost of the first 2,000 automobiles produced? Between which points is the oppor- tunity cost per thousand automobiles highest? Between which points is the opportunity cost per thousand tons of beef highest? b. Label a point P inside the...
first, move the graph increases/decreases increases/decreases negative/positive/zero The following graph shows the production possibilities curve (PPC)...
 first, move the graph
increases/decreases
increases/decreases
negative/positive/zero
The following graph shows the production possibilities curve (PPC) of an economy that produces food and computers. Suppose that the government eliminates restrictions on foreign private investment. This encourages a large number of multinational corporations to invest in this economy, which increases the amount of capital in the economy 0 0 Adjust the PPC to show the economy's new production possibilities after the increase in capital. 32 PPC 24 O 16 PPC 10...
first, move the graph
increases/decreases
increases/decreases
negative/positive/zero
The following graph shows the production possibilities curve (PPC) of an economy that produces food and computers. Suppose that the government eliminates restrictions on foreign private investment. This encourages a large number of multinational corporations to invest in this economy, which increases the amount of capital in the economy 0 0 Adjust the PPC to show the economy's new production possibilities after the increase in capital. 32 PPC 24 O 16 PPC 10...
 Understanding Production Possibilities Using the following table for a hypothetical economy plot your data on a graph. Military 110 5 10s o 95 15 80 Consumer 0 60 40 35 50 10 20 60 Suppose the Economy is operating at point B. What is the opportunity cost of 10 additional units of consumer goods? Between which points is the opportunity cost of b producing consumer goods at maximum? A combination of 70 units of military goods and 45 units of...
 A production possibilities table for DVDs and computers is shown below Production Alternatives Type of Production A Computers DVDs 0 20 40 60 80 80 70 35 a. Show these data graphically, and then identify a point that indicates an inefficient use of resources and a point that indicates an unattainable combination of goods Instructions: Use the tool provided 'PPC to draw a PPC curve (plot 5 points total) b. Does the economy above demonstrate the law of increasing opportunity cost?
 Complete the Following Table: Units of Health Care Units of Education Marginal Cost of Health Care Production 0 units 160 I Total Cost of 1 units 135 M C) = value of the education for one units of TC = value of the units of education forepone 2 units 115 units of writer units MC MC, - value of the value of the education foregone TC -value of the of education foregone 3 units 105 units of MC- value of...
 In the accompanying graph construct a production possibilities curve for a nation with the following maximum output combinations. The Production Possibilities Curve Food ideo Games 0 10 10 16 19 1.) Using the point drawing tool, plot the four output combinations from the table above. Properly label each point. 2.) Using the 4-point curved Nne drewing tool, draw a curve connecting these points. Label this curve Carefuly towow the instructions above, and only draw the required abjects The shape of...
 ECON 2303 HW I SP 20 A production possibilities table for bananas and apples is shown below. Type of Production Bananas (in pounds) Apples (in pounds) A 0 100 Production Alternatives B C D 20 40 60 75 50 25 E 80 0 a. Show these data graphically. Instructions: Use the tool provided PPC to draw a PPC curve (plot 5 points total). Apples (in pounds) 0 80 100 20 40 60 Bananas (in pounds) b. Does the economy above...
 1- Homewórk Saved A production possibilities table for DVDs and computers is shown below. Production Alternatives Type of Production A Computers DVDs 20 40 60 55 35 2 80 80 esa. Show these data graphically. Instructions: Use the tool provided 'PPC' to draw a PPC curve (plot 5 points total). Tools 100 90 80 70 PPC Computers b. What is the opportunity cost of the first 20 computers? (Cick to select c. Between which two consecutive points along the PPC...
 A production possibilities table for DVDs and computers is shown
below.
Point (Click to
select) G F D B C A is
an example of an inefficient point, while (Click to
select) G B A D F C is
an example of an unattainable point.
b. Does the economy above demonstrate the law of increasing
opportunity cost?
(Click to
select) Yes No
Production Alternatives Type of Production A Computers DVDs 20 60 80 80 70 35 a. Show these data graphically, and then identify a point that indicates an inefficient use of resources and a point that indicates...
A production possibilities table for DVDs and computers is shown
below.
Point (Click to
select) G F D B C A is
an example of an inefficient point, while (Click to
select) G B A D F C is
an example of an unattainable point.
b. Does the economy above demonstrate the law of increasing
opportunity cost?
(Click to
select) Yes No
Production Alternatives Type of Production A Computers DVDs 20 60 80 80 70 35 a. Show these data graphically, and then identify a point that indicates an inefficient use of resources and a point that indicates...
 urgent please
Production Possibilities Analysis The table below is a set of hypothetical production possibilities for a nation. . Automobiles Beef Combination (thousands) (thousands of tons) 10 4 0 9-4 10 a. Plot these production possibilities data. What is. the opportunity cost of the first 2,000 automobiles produced? Between which points is the oppor- tunity cost per thousand automobiles highest? Between which points is the opportunity cost per thousand tons of beef highest? b. Label a point P inside the...
urgent please
Production Possibilities Analysis The table below is a set of hypothetical production possibilities for a nation. . Automobiles Beef Combination (thousands) (thousands of tons) 10 4 0 9-4 10 a. Plot these production possibilities data. What is. the opportunity cost of the first 2,000 automobiles produced? Between which points is the oppor- tunity cost per thousand automobiles highest? Between which points is the opportunity cost per thousand tons of beef highest? b. Label a point P inside the...
 first, move the graph
increases/decreases
increases/decreases
negative/positive/zero
The following graph shows the production possibilities curve (PPC) of an economy that produces food and computers. Suppose that the government eliminates restrictions on foreign private investment. This encourages a large number of multinational corporations to invest in this economy, which increases the amount of capital in the economy 0 0 Adjust the PPC to show the economy's new production possibilities after the increase in capital. 32 PPC 24 O 16 PPC 10...
first, move the graph
increases/decreases
increases/decreases
negative/positive/zero
The following graph shows the production possibilities curve (PPC) of an economy that produces food and computers. Suppose that the government eliminates restrictions on foreign private investment. This encourages a large number of multinational corporations to invest in this economy, which increases the amount of capital in the economy 0 0 Adjust the PPC to show the economy's new production possibilities after the increase in capital. 32 PPC 24 O 16 PPC 10...
Most questions answered within 3 hours.
-
Where is the error in this code sequence?
String s1 = "Hello";
String s2 = "ello";...
asked 10 months ago -
Financial data for Joel de Paris, Inc., for last year
follow:
Joel de Paris, Inc.
Balance...
asked 10 months ago -
Consider this reaction:
Al2(SO4)3 (aq)+ BaCl3
(aq) Al2Cl6 (aq)- +
3BaSO4(s) . What is the...
asked 10 months ago -
Suppose that Savneet is considering increasing her
recent random sample from 20 car rentals to 40...
asked 10 months ago -
Trucks arrive at an unloading terminal at an average rate of 120
per hour.
Trucks arrive...
asked 10 months ago -
Why are methanol and ethanol completely soluble in water while
octanol is not very little soluble....
asked 10 months ago -
A facilities manager at a university reads in a research report
that the mean amount of...
asked 10 months ago -
When the CuSO4 is rehydrated by adding water to the anhydrous
compound, is this an endothermic...
asked 10 months ago -
A ray of sunlight is passing from diamond into crown glass; the
angle of incidence is...
asked 10 months ago -
A block of mass 0.249 kg is placed on top of a light, vertical
spring of...
asked 10 months ago -
how do the kidneys compensate in the presences of acidosis
a) trigger hyperventilate
b) reserve acid...
asked 10 months ago -
Question 501 pts
The rental rate of capital to the firm increases. Which of the
following...
asked 10 months ago