Selected data from the 2015 financial statements of KRJ Manufacturing are presented below. Calculate the total...
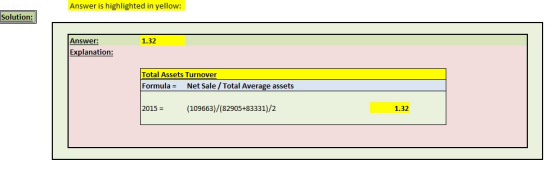
Selected data from the 2015 financial statements of KRJ Manufacturing are presented below. Calculate the total asset turnover for the year, rounded to two decimal places. e.g. 20.00.
Sales $109,663
Gross profits $94,084
Operating profits (EBIT) $34,571
Earnings before taxes (EBT) $27,189
Net profits $17,467
Tax expense 9,549
Depreciation expense $14,702
Total assets, Dec. 31, 2014 $82,905
Total assets, Dec. 31, 2015 $83,331
Total equity, Dec. 31, 2014 $46,228
Total equity, Dec. 31, 2015 $49,950
Cash flow from operations $33,951
Homework Answers
Hi
Let me know in case any issue and query:
Total Assets Turnover ratio = Net Sale / Total Average assets
Add Answer to:
Selected data from the 2015 financial statements of KRJ
Manufacturing are presented below. Calculate the total...
Selected data from the 2015 financial statements of KRJ Manufacturing are presented below. Calculate the financial...
Selected data from the 2015 financial statements of KRJ Manufacturing are presented below. Calculate the financial leverage multiplier for the year, rounded to two decimal places. e.g. 20.00. Sales $180,267 Gross profits $97,391 Operating profits (EBIT) $25,762 Earnings before taxes (EBT) $28,724 Net profits $19,689 Tax expense 9,013 Depreciation expense $10,295 Total assets, Dec. 31, 2014 $112,485 Total assets, Dec. 31, 2015 $116,751 Total equity, Dec. 31, 2014 $56,593 Total equity, Dec. 31, 2015 $40,735 Cash flow from operations $26,120
QUESTION 4 Selected data from the 2019 financial statements of KRJ Manufacturing are presented below. On...
 QUESTION 4 Selected data from the 2019 financial statements of KRJ Manufacturing are presented below. On the company's common-sized income statement, what would be the amount (i.e., percentage) shown for salaries expense? Present your answer in percentage terms, rounded to one decimal place. e.g. 20.096. Sales Cost of goods sold Salaries expense Tax expense Net income Total liabilities Total assets Cash flow from operations $118,621 $57,954 $7,336 $6,616 $11,510 $29,549 $53,064 $33,361
QUESTION 8 Selected data from the 2019 financial statements of KRJ Manufacturing are presented below. On...
 QUESTION 8 Selected data from the 2019 financial statements of KRJ Manufacturing are presented below. On the company's common-sized balance sheet, what would be the amount (i.e., percentage) shown for accrued expenses? Present your answer in percentage terms, rounded to one decimal place. e.g. 20.0%. Sales Cost of goods sold Salaries expense Tax expense Net income Cash Accounts receivable Inventory Net fixed assets Total assets Accounts payable Accrued expenses Long-term debt Total liabilities Cash flow from operations $16,715 $11,213 $3,697...
2015 to compare 4-9. (Ratio analysis) The financial statements and industry norms are shown be for...
 2015 to compare 4-9. (Ratio analysis) The financial statements and industry norms are shown be for Pamplin, Inc.: a. Compute the financial ratios for Pamplin for 2014 and for 2015 to com both against the industry norms. b. How liquid is the firm? c. Areits managers generating an adequate operating profit on the firm's d. How is the firm financing its assets? e. Are its managers generating a good return on equity? INDUSTRY NORN 5.00 3.00 2.20 90.00 0.33 Current...
Using data available in the case, calculate the annual growth rate from 2014 to 2015, and from 2015 to 2016 (in percenta...
 Using data available in the case, calculate the annual growth
rate from 2014 to 2015, and from 2015 to 2016 (in percentages). All
calculations should be rounded to one decimal (e.g., 12.7%)
I need help filling in these percentages.
2014-2015 2015-2016 Revenue Cost of Goods Sold Gross Profit % Operating Income Total Operating Expenses Net Income % Working Capital Year Ended: Dec. 27, 2014 Dec. 31, 2016 Dec. 26, 2015 Income Statement Data: $968.99 $1,024.04 $966.48 Revenue 64.11 63.47 Less...
Using data available in the case, calculate the annual growth
rate from 2014 to 2015, and from 2015 to 2016 (in percentages). All
calculations should be rounded to one decimal (e.g., 12.7%)
I need help filling in these percentages.
2014-2015 2015-2016 Revenue Cost of Goods Sold Gross Profit % Operating Income Total Operating Expenses Net Income % Working Capital Year Ended: Dec. 27, 2014 Dec. 31, 2016 Dec. 26, 2015 Income Statement Data: $968.99 $1,024.04 $966.48 Revenue 64.11 63.47 Less...
Brief Exercise 222 Selected data from the Florida Fruit Company are presented below: Total assets Average...
 Brief Exercise 222 Selected data from the Florida Fruit Company are presented below: Total assets Average total assets Net income Net sales Average common stockholders' equity Net cash provided by operating activities $1,500,000 1,850,000 175,000 1,300,000 1,000,000 275,000 Assuming that no dividends were declared or paid during the period. Calculate the profit margin. (Round answer to 1 decimal place, e.g. 15.2%.) Profit margin Compute asset turnover. (Round answer to 2 decimal places, e.g. 0.25.) times Asset turnover Compute return on...
P10-7A You have been presented with the following selected information from the financial statements of one...
 P10-7A You have been presented with the following selected information from the financial statements of one of Canada's largest dairy producers, Saputo Inc. (in millions): 2015 2014 2013 Statement of financial position Accounts receivable S 785 S 807 $ 625 Inventory Total current assets 1,006 1.962 933 1,896 770 1,513 Total assets 6.800 6,357 5,194 Current liabilities 1,179 1,725 1,227 Total liabilities 3,172 3,518 2,888 Income statement Net sales $10,658 $9,223 $7,298 Cost of goods sold 7,688 6,518 5,136 Interest...
P10-7A You have been presented with the following selected information from the financial statements of one...
 P10-7A You have been presented with the following selected information from the financial statements of one of Canada's largest dairy producers, Saputo Inc. (in millions): 2015 2014 2013 Statement of financial position Accounts receivable $ 785 S 807 $ 625 Inventory 1,006 933 770 Total current assets 1,962 1,896 1,513 Total assets 6,800 6,357 5,194 Current liabilities 1,179 1,725 1,227 Total liabilities 3,172 3,518 2,888 Income statement Net sales $10,658 $9,223 $7,298 Cost of goods sold 7,688 6,518 5,136 Interest...
her 0012 6o0 1. The following selected data were taken from the financial statements of the...
 her 0012 6o0 1. The following selected data were taken from the financial statements of the Columbus Group for December 31, 2016, 2015, and 2014: tncobe000002.12w mniolod ooal holio 0 ub oo Dec.31, 2015 $2,700,000 1,000,000 no b Dec. 31, 2014 Dec. 31, 2016 $3,000,000 Total assets $2,400,000 Notes payable (9% interest) Common stock Preferred $7 stock, $100 par (no change during 1,000,000 1,000,000 400,000 400,000 400,000 200,000 200,000 200,000 year) Retained earnings 1,126,000 896,000 600,000 The 2016 net income...
Part 1: Ratio Analysis calculate the following ratios Part 2: Perform a vertical analysis of statement...
 Part 1: Ratio Analysis calculate the following ratios
Part 2: Perform a vertical analysis of statement of financial
position & Income statement
Part 3: Perform a Horizontal Analysis of statement of
Financial Position for 2015 and 2014 & Income statement for
2015
Instructions: 1. On pages three and four, you will find condensed statement of financial position and income statement data for Waterloo Corporation. 2. Use the same information to answer all the three parts. 3. Part 1: a. In...
Part 1: Ratio Analysis calculate the following ratios
Part 2: Perform a vertical analysis of statement of financial
position & Income statement
Part 3: Perform a Horizontal Analysis of statement of
Financial Position for 2015 and 2014 & Income statement for
2015
Instructions: 1. On pages three and four, you will find condensed statement of financial position and income statement data for Waterloo Corporation. 2. Use the same information to answer all the three parts. 3. Part 1: a. In...
 QUESTION 4 Selected data from the 2019 financial statements of KRJ Manufacturing are presented below. On the company's common-sized income statement, what would be the amount (i.e., percentage) shown for salaries expense? Present your answer in percentage terms, rounded to one decimal place. e.g. 20.096. Sales Cost of goods sold Salaries expense Tax expense Net income Total liabilities Total assets Cash flow from operations $118,621 $57,954 $7,336 $6,616 $11,510 $29,549 $53,064 $33,361
 QUESTION 8 Selected data from the 2019 financial statements of KRJ Manufacturing are presented below. On the company's common-sized balance sheet, what would be the amount (i.e., percentage) shown for accrued expenses? Present your answer in percentage terms, rounded to one decimal place. e.g. 20.0%. Sales Cost of goods sold Salaries expense Tax expense Net income Cash Accounts receivable Inventory Net fixed assets Total assets Accounts payable Accrued expenses Long-term debt Total liabilities Cash flow from operations $16,715 $11,213 $3,697...
 2015 to compare 4-9. (Ratio analysis) The financial statements and industry norms are shown be for Pamplin, Inc.: a. Compute the financial ratios for Pamplin for 2014 and for 2015 to com both against the industry norms. b. How liquid is the firm? c. Areits managers generating an adequate operating profit on the firm's d. How is the firm financing its assets? e. Are its managers generating a good return on equity? INDUSTRY NORN 5.00 3.00 2.20 90.00 0.33 Current...
 Using data available in the case, calculate the annual growth
rate from 2014 to 2015, and from 2015 to 2016 (in percentages). All
calculations should be rounded to one decimal (e.g., 12.7%)
I need help filling in these percentages.
2014-2015 2015-2016 Revenue Cost of Goods Sold Gross Profit % Operating Income Total Operating Expenses Net Income % Working Capital Year Ended: Dec. 27, 2014 Dec. 31, 2016 Dec. 26, 2015 Income Statement Data: $968.99 $1,024.04 $966.48 Revenue 64.11 63.47 Less...
Using data available in the case, calculate the annual growth
rate from 2014 to 2015, and from 2015 to 2016 (in percentages). All
calculations should be rounded to one decimal (e.g., 12.7%)
I need help filling in these percentages.
2014-2015 2015-2016 Revenue Cost of Goods Sold Gross Profit % Operating Income Total Operating Expenses Net Income % Working Capital Year Ended: Dec. 27, 2014 Dec. 31, 2016 Dec. 26, 2015 Income Statement Data: $968.99 $1,024.04 $966.48 Revenue 64.11 63.47 Less...
 Brief Exercise 222 Selected data from the Florida Fruit Company are presented below: Total assets Average total assets Net income Net sales Average common stockholders' equity Net cash provided by operating activities $1,500,000 1,850,000 175,000 1,300,000 1,000,000 275,000 Assuming that no dividends were declared or paid during the period. Calculate the profit margin. (Round answer to 1 decimal place, e.g. 15.2%.) Profit margin Compute asset turnover. (Round answer to 2 decimal places, e.g. 0.25.) times Asset turnover Compute return on...
 P10-7A You have been presented with the following selected information from the financial statements of one of Canada's largest dairy producers, Saputo Inc. (in millions): 2015 2014 2013 Statement of financial position Accounts receivable S 785 S 807 $ 625 Inventory Total current assets 1,006 1.962 933 1,896 770 1,513 Total assets 6.800 6,357 5,194 Current liabilities 1,179 1,725 1,227 Total liabilities 3,172 3,518 2,888 Income statement Net sales $10,658 $9,223 $7,298 Cost of goods sold 7,688 6,518 5,136 Interest...
 P10-7A You have been presented with the following selected information from the financial statements of one of Canada's largest dairy producers, Saputo Inc. (in millions): 2015 2014 2013 Statement of financial position Accounts receivable $ 785 S 807 $ 625 Inventory 1,006 933 770 Total current assets 1,962 1,896 1,513 Total assets 6,800 6,357 5,194 Current liabilities 1,179 1,725 1,227 Total liabilities 3,172 3,518 2,888 Income statement Net sales $10,658 $9,223 $7,298 Cost of goods sold 7,688 6,518 5,136 Interest...
 her 0012 6o0 1. The following selected data were taken from the financial statements of the Columbus Group for December 31, 2016, 2015, and 2014: tncobe000002.12w mniolod ooal holio 0 ub oo Dec.31, 2015 $2,700,000 1,000,000 no b Dec. 31, 2014 Dec. 31, 2016 $3,000,000 Total assets $2,400,000 Notes payable (9% interest) Common stock Preferred $7 stock, $100 par (no change during 1,000,000 1,000,000 400,000 400,000 400,000 200,000 200,000 200,000 year) Retained earnings 1,126,000 896,000 600,000 The 2016 net income...
 Part 1: Ratio Analysis calculate the following ratios
Part 2: Perform a vertical analysis of statement of financial
position & Income statement
Part 3: Perform a Horizontal Analysis of statement of
Financial Position for 2015 and 2014 & Income statement for
2015
Instructions: 1. On pages three and four, you will find condensed statement of financial position and income statement data for Waterloo Corporation. 2. Use the same information to answer all the three parts. 3. Part 1: a. In...
Part 1: Ratio Analysis calculate the following ratios
Part 2: Perform a vertical analysis of statement of financial
position & Income statement
Part 3: Perform a Horizontal Analysis of statement of
Financial Position for 2015 and 2014 & Income statement for
2015
Instructions: 1. On pages three and four, you will find condensed statement of financial position and income statement data for Waterloo Corporation. 2. Use the same information to answer all the three parts. 3. Part 1: a. In...
Most questions answered within 3 hours.
-
Where is the error in this code sequence?
String s1 = "Hello";
String s2 = "ello";...
asked 10 months ago -
Financial data for Joel de Paris, Inc., for last year
follow:
Joel de Paris, Inc.
Balance...
asked 10 months ago -
Consider this reaction:
Al2(SO4)3 (aq)+ BaCl3
(aq) Al2Cl6 (aq)- +
3BaSO4(s) . What is the...
asked 10 months ago -
Suppose that Savneet is considering increasing her
recent random sample from 20 car rentals to 40...
asked 10 months ago -
Trucks arrive at an unloading terminal at an average rate of 120
per hour.
Trucks arrive...
asked 10 months ago -
Why are methanol and ethanol completely soluble in water while
octanol is not very little soluble....
asked 10 months ago -
A facilities manager at a university reads in a research report
that the mean amount of...
asked 10 months ago -
When the CuSO4 is rehydrated by adding water to the anhydrous
compound, is this an endothermic...
asked 10 months ago -
A ray of sunlight is passing from diamond into crown glass; the
angle of incidence is...
asked 10 months ago -
A block of mass 0.249 kg is placed on top of a light, vertical
spring of...
asked 10 months ago -
how do the kidneys compensate in the presences of acidosis
a) trigger hyperventilate
b) reserve acid...
asked 10 months ago -
Question 501 pts
The rental rate of capital to the firm increases. Which of the
following...
asked 10 months ago