Which graph might represent the relationship between rainfall and raincoat sales?
Click or tap the appropriate place in the image.
 A
A
Homework Answers
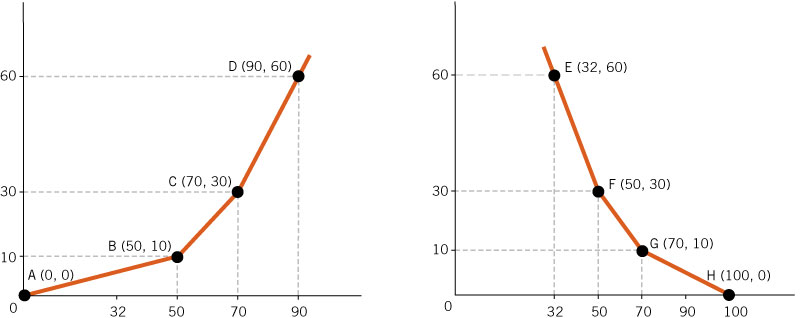
The first graph i.e graph A represents the relationship between rainfall and raincoat sales. We know that there is a positive relationship between rainfall and raincoat sales i.e. when there would be high rainfall the raincoat sales would increase during that time.
Now, graph A shows that when there is no rainfall, there is no raincoat sales at point A(0,0). When the rainfall increases at point B, the raincoat sales also increases at point B (50,10). Now as we go up higher from point B to point C and D we see that the raincoat sales increases gradually with the rainfall.
On the other hand, graph B shows the opposite i.e. with higher rainfall the raincoat sales decreases which is unlikely. At point H (100,0) with 100 units of rainfall the raincoat sales being 0 is not possible.
Add Answer to:
Which graph might represent the relationship between rainfall
and raincoat sales?
Click or tap the appropriate...
Solubility (g solute in 100 mL H2O) OP 3 According to your data, is the graph...
 Solubility (g solute in 100 mL H2O) OP 3 According to your data, is the graph below consistent with the relative solubilities of NaCl and KNO3 at different temperatures? Explain your answer. 100 90 80 70 60 KNO3 50 40 30- NaCl 20 10 0 10 20 30 40 50 60 70 80 90 100 Temperature (°C)
The graph below shows solubility curves of various ionic compounds. At 50 degrees C the solubility...
 The
graph below shows solubility curves of various ionic compounds.
At 50 degrees C the solubility of KNO3 is 80g per 100g of
water.
The solution is heated to 70 degrees C.
How many more grams of potassium nitrate mistxbe added to make
the solution saturated?
150 KI 140 130 120 110 NaNO3 100 KNO3 90 Grams of solute per 100 g H2O 80 70 NH3) 60 NHACI 50 -KCI Naci 40 30 20 TKCIO3 10 Cez(SO4)3 0 0 10...
The
graph below shows solubility curves of various ionic compounds.
At 50 degrees C the solubility of KNO3 is 80g per 100g of
water.
The solution is heated to 70 degrees C.
How many more grams of potassium nitrate mistxbe added to make
the solution saturated?
150 KI 140 130 120 110 NaNO3 100 KNO3 90 Grams of solute per 100 g H2O 80 70 NH3) 60 NHACI 50 -KCI Naci 40 30 20 TKCIO3 10 Cez(SO4)3 0 0 10...
everything is correct I just need the answer to part D on which graph is right....
 everything is correct I just
need the answer to part D on which graph is right.
The RMC Corporation blends three raw materials to produce two products: a fuel additive and a solvent base. Each ton of fuel additive is a mixture of 1/4 ton of material 1 and 3/4 ton of material 3. A ton of solvent base is a mixture of 1/2 ton of material 1, 1/8 ton of material 2, and 3/8 ton of material 3. RMC's...
everything is correct I just
need the answer to part D on which graph is right.
The RMC Corporation blends three raw materials to produce two products: a fuel additive and a solvent base. Each ton of fuel additive is a mixture of 1/4 ton of material 1 and 3/4 ton of material 3. A ton of solvent base is a mixture of 1/2 ton of material 1, 1/8 ton of material 2, and 3/8 ton of material 3. RMC's...
Question 3 of 15 > Attempt 5 The graphs represent the labor market and production function...
 Question 3 of 15 > Attempt 5 The graphs represent the labor market and production function for the hypothetical country of Aquamarine Island. Move point A to the point on the production function that represents potential GDP for this economy. Assume the economy is operating at full employment. Note that the first graph is for reference only. Real wage rate $100 Labor supply Production function Real GDP (in millions) Labor demand 0 10 20 30 40 50 60 70 Labor...
Consider the graph showing solubility curves of various ionic compounds. Determine the molarity of a saturated...
 Consider the graph showing solubility curves of various ionic
compounds.
Determine the molarity of a saturated KCl solution at 80
degrees C. Molar mass of KCl is 74.55 g/mol and density of water is
1.00 g/mL
150 KI 140 130 120 110 NaNO3 100 KNO3 90 Grams of solute per 100 g H20 80 70 NH37 60 NHACI 50 -KCI 40 Naci 30 20 KCIÓ: 10 Cez(SO4)3 0 0 10 20 30 40 50 60 70 80 90 100 Temperature...
Consider the graph showing solubility curves of various ionic
compounds.
Determine the molarity of a saturated KCl solution at 80
degrees C. Molar mass of KCl is 74.55 g/mol and density of water is
1.00 g/mL
150 KI 140 130 120 110 NaNO3 100 KNO3 90 Grams of solute per 100 g H20 80 70 NH37 60 NHACI 50 -KCI 40 Naci 30 20 KCIÓ: 10 Cez(SO4)3 0 0 10 20 30 40 50 60 70 80 90 100 Temperature...
not sure on this answrer, any help? The graph below is an ogive of scores on...
 not sure on this answrer, any help?
The graph below is an ogive of scores on a math test. The vertical axis in an ogive is the cumulative relative frequency and can also be interpreted as a percentile. Use the graph to approximate the test score that corresponds to the 30th percentile. Percentile Ranks of Math Test Scores O A. 4 B. 9 O C. 56 OD. 50 Percentile 100 90 80 70 60 50 40 30 20 10- 0...
not sure on this answrer, any help?
The graph below is an ogive of scores on a math test. The vertical axis in an ogive is the cumulative relative frequency and can also be interpreted as a percentile. Use the graph to approximate the test score that corresponds to the 30th percentile. Percentile Ranks of Math Test Scores O A. 4 B. 9 O C. 56 OD. 50 Percentile 100 90 80 70 60 50 40 30 20 10- 0...
I need help with A & B. The graph for both are on the right. I...
 I need help with A & B.
The graph for both are on the right.
I need help with part C.
I need help with part D as
well.
So all together Parts A, B, C, D.
Homework: MEL Homework 10 - Using Units to Solve Engineering Score: 0 of 2 pts HW 2 of 8 (1 complete) Instructor-created question - X iMore Info Below is a graph of the vertical position of a person bungee jumping, in meters. Click...
I need help with A & B.
The graph for both are on the right.
I need help with part C.
I need help with part D as
well.
So all together Parts A, B, C, D.
Homework: MEL Homework 10 - Using Units to Solve Engineering Score: 0 of 2 pts HW 2 of 8 (1 complete) Instructor-created question - X iMore Info Below is a graph of the vertical position of a person bungee jumping, in meters. Click...
2. Working with Numbers and Graphs Q2 The following graph illustrates the demand (D) curve of...
 2. Working with Numbers and Graphs Q2 The following graph illustrates the demand (D) curve of an industry as well as the marginal cost (MC) and average total cost (ATC) curves of the only firm in this industry. Refer to the graph to answer the questions that follow. PRICE (Dollars) 70 80 90 100 0 10 20 30 40 50 60 QUANTITY (Units) A We were unable to transcribe this image
100 Mixtures and Solutions 90 Instructions: Use the following image to answer the NaNO following questions....
 100 Mixtures and Solutions 90 Instructions: Use the following image to answer the NaNO following questions. 70 1. A solution contains 40 g of NaCl per 100g of water 60 CaCl at 100 C. Is the solution unsaturated, saturated or 50 POINO KC supersaturated? 9 40 NaC 30 20 KOO 2. A solution contains 50 g of KCl per 100 g of water at 25 C. Is the solution unsaturated, saturated or 10 Ce(SO); 0 10 20 30 40 50...
help 3. Using the solubility graph provided, predict which salt is most soluble at 75 degrees in water 160 140 N&am...
 help
3. Using the solubility graph provided, predict which salt is most soluble at 75 degrees in water 160 140 N&CIO, NaNO, 130 00 KNO 60 K,CrO. NH,C 401 Ka 20 KCO, KMaO. 20 30 40 50 60 70 0 90 100 KOo. 10 Temperature in degrees C ON HN angos pgngos snounluue
3. Using the solubility graph provided, predict which salt is most soluble at 75 degrees in water 160 140 N&CIO, NaNO, 130 00 KNO 60 K,CrO. NH,C...
help
3. Using the solubility graph provided, predict which salt is most soluble at 75 degrees in water 160 140 N&CIO, NaNO, 130 00 KNO 60 K,CrO. NH,C 401 Ka 20 KCO, KMaO. 20 30 40 50 60 70 0 90 100 KOo. 10 Temperature in degrees C ON HN angos pgngos snounluue
3. Using the solubility graph provided, predict which salt is most soluble at 75 degrees in water 160 140 N&CIO, NaNO, 130 00 KNO 60 K,CrO. NH,C...
 Solubility (g solute in 100 mL H2O) OP 3 According to your data, is the graph below consistent with the relative solubilities of NaCl and KNO3 at different temperatures? Explain your answer. 100 90 80 70 60 KNO3 50 40 30- NaCl 20 10 0 10 20 30 40 50 60 70 80 90 100 Temperature (°C)
 The
graph below shows solubility curves of various ionic compounds.
At 50 degrees C the solubility of KNO3 is 80g per 100g of
water.
The solution is heated to 70 degrees C.
How many more grams of potassium nitrate mistxbe added to make
the solution saturated?
150 KI 140 130 120 110 NaNO3 100 KNO3 90 Grams of solute per 100 g H2O 80 70 NH3) 60 NHACI 50 -KCI Naci 40 30 20 TKCIO3 10 Cez(SO4)3 0 0 10...
The
graph below shows solubility curves of various ionic compounds.
At 50 degrees C the solubility of KNO3 is 80g per 100g of
water.
The solution is heated to 70 degrees C.
How many more grams of potassium nitrate mistxbe added to make
the solution saturated?
150 KI 140 130 120 110 NaNO3 100 KNO3 90 Grams of solute per 100 g H2O 80 70 NH3) 60 NHACI 50 -KCI Naci 40 30 20 TKCIO3 10 Cez(SO4)3 0 0 10...
 everything is correct I just
need the answer to part D on which graph is right.
The RMC Corporation blends three raw materials to produce two products: a fuel additive and a solvent base. Each ton of fuel additive is a mixture of 1/4 ton of material 1 and 3/4 ton of material 3. A ton of solvent base is a mixture of 1/2 ton of material 1, 1/8 ton of material 2, and 3/8 ton of material 3. RMC's...
everything is correct I just
need the answer to part D on which graph is right.
The RMC Corporation blends three raw materials to produce two products: a fuel additive and a solvent base. Each ton of fuel additive is a mixture of 1/4 ton of material 1 and 3/4 ton of material 3. A ton of solvent base is a mixture of 1/2 ton of material 1, 1/8 ton of material 2, and 3/8 ton of material 3. RMC's...
 Question 3 of 15 > Attempt 5 The graphs represent the labor market and production function for the hypothetical country of Aquamarine Island. Move point A to the point on the production function that represents potential GDP for this economy. Assume the economy is operating at full employment. Note that the first graph is for reference only. Real wage rate $100 Labor supply Production function Real GDP (in millions) Labor demand 0 10 20 30 40 50 60 70 Labor...
 Consider the graph showing solubility curves of various ionic
compounds.
Determine the molarity of a saturated KCl solution at 80
degrees C. Molar mass of KCl is 74.55 g/mol and density of water is
1.00 g/mL
150 KI 140 130 120 110 NaNO3 100 KNO3 90 Grams of solute per 100 g H20 80 70 NH37 60 NHACI 50 -KCI 40 Naci 30 20 KCIÓ: 10 Cez(SO4)3 0 0 10 20 30 40 50 60 70 80 90 100 Temperature...
Consider the graph showing solubility curves of various ionic
compounds.
Determine the molarity of a saturated KCl solution at 80
degrees C. Molar mass of KCl is 74.55 g/mol and density of water is
1.00 g/mL
150 KI 140 130 120 110 NaNO3 100 KNO3 90 Grams of solute per 100 g H20 80 70 NH37 60 NHACI 50 -KCI 40 Naci 30 20 KCIÓ: 10 Cez(SO4)3 0 0 10 20 30 40 50 60 70 80 90 100 Temperature...
 not sure on this answrer, any help?
The graph below is an ogive of scores on a math test. The vertical axis in an ogive is the cumulative relative frequency and can also be interpreted as a percentile. Use the graph to approximate the test score that corresponds to the 30th percentile. Percentile Ranks of Math Test Scores O A. 4 B. 9 O C. 56 OD. 50 Percentile 100 90 80 70 60 50 40 30 20 10- 0...
not sure on this answrer, any help?
The graph below is an ogive of scores on a math test. The vertical axis in an ogive is the cumulative relative frequency and can also be interpreted as a percentile. Use the graph to approximate the test score that corresponds to the 30th percentile. Percentile Ranks of Math Test Scores O A. 4 B. 9 O C. 56 OD. 50 Percentile 100 90 80 70 60 50 40 30 20 10- 0...
 I need help with A & B.
The graph for both are on the right.
I need help with part C.
I need help with part D as
well.
So all together Parts A, B, C, D.
Homework: MEL Homework 10 - Using Units to Solve Engineering Score: 0 of 2 pts HW 2 of 8 (1 complete) Instructor-created question - X iMore Info Below is a graph of the vertical position of a person bungee jumping, in meters. Click...
I need help with A & B.
The graph for both are on the right.
I need help with part C.
I need help with part D as
well.
So all together Parts A, B, C, D.
Homework: MEL Homework 10 - Using Units to Solve Engineering Score: 0 of 2 pts HW 2 of 8 (1 complete) Instructor-created question - X iMore Info Below is a graph of the vertical position of a person bungee jumping, in meters. Click...
 2. Working with Numbers and Graphs Q2 The following graph illustrates the demand (D) curve of an industry as well as the marginal cost (MC) and average total cost (ATC) curves of the only firm in this industry. Refer to the graph to answer the questions that follow. PRICE (Dollars) 70 80 90 100 0 10 20 30 40 50 60 QUANTITY (Units) A We were unable to transcribe this image
 100 Mixtures and Solutions 90 Instructions: Use the following image to answer the NaNO following questions. 70 1. A solution contains 40 g of NaCl per 100g of water 60 CaCl at 100 C. Is the solution unsaturated, saturated or 50 POINO KC supersaturated? 9 40 NaC 30 20 KOO 2. A solution contains 50 g of KCl per 100 g of water at 25 C. Is the solution unsaturated, saturated or 10 Ce(SO); 0 10 20 30 40 50...
 help
3. Using the solubility graph provided, predict which salt is most soluble at 75 degrees in water 160 140 N&CIO, NaNO, 130 00 KNO 60 K,CrO. NH,C 401 Ka 20 KCO, KMaO. 20 30 40 50 60 70 0 90 100 KOo. 10 Temperature in degrees C ON HN angos pgngos snounluue
3. Using the solubility graph provided, predict which salt is most soluble at 75 degrees in water 160 140 N&CIO, NaNO, 130 00 KNO 60 K,CrO. NH,C...
help
3. Using the solubility graph provided, predict which salt is most soluble at 75 degrees in water 160 140 N&CIO, NaNO, 130 00 KNO 60 K,CrO. NH,C 401 Ka 20 KCO, KMaO. 20 30 40 50 60 70 0 90 100 KOo. 10 Temperature in degrees C ON HN angos pgngos snounluue
3. Using the solubility graph provided, predict which salt is most soluble at 75 degrees in water 160 140 N&CIO, NaNO, 130 00 KNO 60 K,CrO. NH,C...
Most questions answered within 3 hours.
-
Where is the error in this code sequence?
String s1 = "Hello";
String s2 = "ello";...
asked 10 months ago -
Financial data for Joel de Paris, Inc., for last year
follow:
Joel de Paris, Inc.
Balance...
asked 10 months ago -
Consider this reaction:
Al2(SO4)3 (aq)+ BaCl3
(aq) Al2Cl6 (aq)- +
3BaSO4(s) . What is the...
asked 10 months ago -
Suppose that Savneet is considering increasing her
recent random sample from 20 car rentals to 40...
asked 10 months ago -
Trucks arrive at an unloading terminal at an average rate of 120
per hour.
Trucks arrive...
asked 10 months ago -
Why are methanol and ethanol completely soluble in water while
octanol is not very little soluble....
asked 10 months ago -
A facilities manager at a university reads in a research report
that the mean amount of...
asked 10 months ago -
When the CuSO4 is rehydrated by adding water to the anhydrous
compound, is this an endothermic...
asked 10 months ago -
A ray of sunlight is passing from diamond into crown glass; the
angle of incidence is...
asked 10 months ago -
A block of mass 0.249 kg is placed on top of a light, vertical
spring of...
asked 10 months ago -
how do the kidneys compensate in the presences of acidosis
a) trigger hyperventilate
b) reserve acid...
asked 10 months ago -
Question 501 pts
The rental rate of capital to the firm increases. Which of the
following...
asked 10 months ago