
Homework Answers
The statistical software outputs for this problem is:


Hence,
a) Test statistic = 1.83
P - value = 0.0339
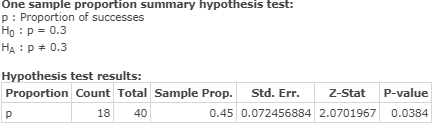
b) Test statistic = 2.07
P - value = 0.0384
c) Test statistic = -2.33
P - value = 0.0098
Add Answer to:
5 CH 9,IU) 1 Saveu Help Save & Exit Submit Calculate the test statistic and p-value...
Calculate the test statistic and p-value for each sample. Use Appendix C-2 to calculate the p-value....
Calculate the test statistic and p-value for each sample. Use Appendix C-2 to calculate the p-value. (Negative values should be indicated by a minus sign. Round your test statistic to 2 decimal places and p-value to 4 decimal places.) Test Statistic p-value (a) H0: ππ ≤ .60 versus H1: ππ > .60, α = .05, x = 56, n = 80 (b) H0: ππ = .30 versus H1: ππ ≠ .30, α = .05, x = 18, n...
Calculate the test statistic and p-value for each sample.(Round your test statistics to 2 decimal places...
 Calculate the test statistic and p-value for each sample.(Round your test statistics to 2 decimal places and p-values to 4 decimal places.) Note: xnumber of successes Test Statistic p-value (a) H0: p=0.60 versus Ha: p > 0.80, α=.05, x=56, n = 80 (c) Ho, p-0.10 versus HA: p 0.10, a-.01, x-3. n-100
please solve and highlight answers Calculate the test statistic and p-value for each sample. Use Appendix...
 please solve and highlight answers
Calculate the test statistic and p-value for each sample. Use Appendix C-2 to calculate the p-value. (Negative values should be Ind icated by a minus sign. Round your test statistic to 3 decimal places and p-value to 4 decimal places.) Test Statistic p-value (a) Ho: 0.50 versus H: T0.50, a 0.05, x= 48. n 81 (b) Ho: T 0.30 versus H: T # 0.30, a 0.05, x 18, n 39 (c) Ho: 0.10 versus H:...
please solve and highlight answers
Calculate the test statistic and p-value for each sample. Use Appendix C-2 to calculate the p-value. (Negative values should be Ind icated by a minus sign. Round your test statistic to 3 decimal places and p-value to 4 decimal places.) Test Statistic p-value (a) Ho: 0.50 versus H: T0.50, a 0.05, x= 48. n 81 (b) Ho: T 0.30 versus H: T # 0.30, a 0.05, x 18, n 39 (c) Ho: 0.10 versus H:...
Test the hypothesis using the P-value approach. Be sure to verily the requirements of the test Ho p-0.3 versus H P>0.3 n-200, x=80; α:01 Calculate the test statistic, zo #0 (Round to two dec...
 Test the hypothesis using the P-value approach. Be sure to verily the requirements of the test Ho p-0.3 versus H P>0.3 n-200, x=80; α:01 Calculate the test statistic, zo #0 (Round to two decimal places as needed) Identify the P-value P-value (Round to three decimal places as needed) Choose the correct result of the hypothesis test for the Pvalue approach belovw ty O A. Reject the nul hypothesis, because the P-value is greater than α O B. Do not reject...
Calculate the test statistic. Chapter 12. Chi-Square Test Saved Help Save & Exit Su Check my...
 Calculate the test
statistic.
Chapter 12. Chi-Square Test Saved Help Save & Exit Su Check my w Given the following contingency table, conduct a test for Independence at the 5% significance level. (You may find It useful to reference the appropriate table: chi-square table or F table) Variable A points Variable B 36 35 31 51 eBook a. Choose the null and alternative hypotheses. Hint Ho: The two variables are independent.; HA: The two variables are dependent. O Ho: The...
Calculate the test
statistic.
Chapter 12. Chi-Square Test Saved Help Save & Exit Su Check my w Given the following contingency table, conduct a test for Independence at the 5% significance level. (You may find It useful to reference the appropriate table: chi-square table or F table) Variable A points Variable B 36 35 31 51 eBook a. Choose the null and alternative hypotheses. Hint Ho: The two variables are independent.; HA: The two variables are dependent. O Ho: The...
Test the hypothesis using the P-value approach. Be sure to verify the requirements of the test....
Test the hypothesis using the P-value approach. Be sure to verify the requirements of the test. H0:p=0.6 versus H1:p>0.6 n=100; x=65; a=0.01 Calculate the test statistic,z0. Z0= ___? Identify the P-value. P-value=____?
ssume that z is the test statistic. (a) H0: μ = 22.5, Ha: μ > 22.5;...
ssume that z is the test statistic. (a) H0: μ = 22.5, Ha: μ > 22.5; x = 24.8, σ = 7.3, n = 37 (i) Calculate the test statistic z. (Round your answer to two decimal places.) (ii) Calculate the p-value. (Round your answer to four decimal places.) (b) H0: μ = 200, Ha: μ < 200; x = 192.1, σ = 34, n = 32 (i) Calculate the test statistic z. (Round your answer to two decimal places.)...
Assume that z is the test statistic. (a) H0: μ = 22.5, Ha: μ > 22.5;...
Assume that z is the test statistic. (a) H0: μ = 22.5, Ha: μ > 22.5; x = 26.7, σ = 7.4, n = 21 (i) Calculate the test statistic z. (Round your answer to two decimal places.) (ii) Calculate the p-value. (Round your answer to four decimal places.) (b) H0: μ = 200, Ha: μ < 200; x = 192, σ = 35, n = 20 (i) Calculate the test statistic z. (Round your answer to two decimal places.)...
Calculate the p-value for a hypothesis test of a proportion. The hypotheses are H0: p=.2, H1:...
Calculate the p-value for a hypothesis test of a proportion. The hypotheses are H0: p=.2, H1: p≠.2, and the test statistic is z = -2.36. Use the normal distribution to calculate the p-value. Round your answer to 4 decimal places
Test the hypothesis using the P-value approach. Be sure to verify the requirements of the test....
Test the hypothesis using the P-value approach. Be sure to verify the requirements of the test. H0: p=0.61 versus H1: p<0.61 n=150, x=84, α=0.05 Is np01−p0≥10? Yes - Your Answer is Correct No Use technology to find the P-value. P-value=__?__ (Round to three decimal places as needed.)
 Calculate the test statistic and p-value for each sample.(Round your test statistics to 2 decimal places and p-values to 4 decimal places.) Note: xnumber of successes Test Statistic p-value (a) H0: p=0.60 versus Ha: p > 0.80, α=.05, x=56, n = 80 (c) Ho, p-0.10 versus HA: p 0.10, a-.01, x-3. n-100
 please solve and highlight answers
Calculate the test statistic and p-value for each sample. Use Appendix C-2 to calculate the p-value. (Negative values should be Ind icated by a minus sign. Round your test statistic to 3 decimal places and p-value to 4 decimal places.) Test Statistic p-value (a) Ho: 0.50 versus H: T0.50, a 0.05, x= 48. n 81 (b) Ho: T 0.30 versus H: T # 0.30, a 0.05, x 18, n 39 (c) Ho: 0.10 versus H:...
please solve and highlight answers
Calculate the test statistic and p-value for each sample. Use Appendix C-2 to calculate the p-value. (Negative values should be Ind icated by a minus sign. Round your test statistic to 3 decimal places and p-value to 4 decimal places.) Test Statistic p-value (a) Ho: 0.50 versus H: T0.50, a 0.05, x= 48. n 81 (b) Ho: T 0.30 versus H: T # 0.30, a 0.05, x 18, n 39 (c) Ho: 0.10 versus H:...
 Test the hypothesis using the P-value approach. Be sure to verily the requirements of the test Ho p-0.3 versus H P>0.3 n-200, x=80; α:01 Calculate the test statistic, zo #0 (Round to two decimal places as needed) Identify the P-value P-value (Round to three decimal places as needed) Choose the correct result of the hypothesis test for the Pvalue approach belovw ty O A. Reject the nul hypothesis, because the P-value is greater than α O B. Do not reject...
 Calculate the test
statistic.
Chapter 12. Chi-Square Test Saved Help Save & Exit Su Check my w Given the following contingency table, conduct a test for Independence at the 5% significance level. (You may find It useful to reference the appropriate table: chi-square table or F table) Variable A points Variable B 36 35 31 51 eBook a. Choose the null and alternative hypotheses. Hint Ho: The two variables are independent.; HA: The two variables are dependent. O Ho: The...
Calculate the test
statistic.
Chapter 12. Chi-Square Test Saved Help Save & Exit Su Check my w Given the following contingency table, conduct a test for Independence at the 5% significance level. (You may find It useful to reference the appropriate table: chi-square table or F table) Variable A points Variable B 36 35 31 51 eBook a. Choose the null and alternative hypotheses. Hint Ho: The two variables are independent.; HA: The two variables are dependent. O Ho: The...
Most questions answered within 3 hours.
-
Where is the error in this code sequence?
String s1 = "Hello";
String s2 = "ello";...
asked 10 months ago -
Financial data for Joel de Paris, Inc., for last year
follow:
Joel de Paris, Inc.
Balance...
asked 10 months ago -
Consider this reaction:
Al2(SO4)3 (aq)+ BaCl3
(aq) Al2Cl6 (aq)- +
3BaSO4(s) . What is the...
asked 10 months ago -
Suppose that Savneet is considering increasing her
recent random sample from 20 car rentals to 40...
asked 10 months ago -
Trucks arrive at an unloading terminal at an average rate of 120
per hour.
Trucks arrive...
asked 10 months ago -
Why are methanol and ethanol completely soluble in water while
octanol is not very little soluble....
asked 10 months ago -
A facilities manager at a university reads in a research report
that the mean amount of...
asked 10 months ago -
When the CuSO4 is rehydrated by adding water to the anhydrous
compound, is this an endothermic...
asked 10 months ago -
A ray of sunlight is passing from diamond into crown glass; the
angle of incidence is...
asked 10 months ago -
A block of mass 0.249 kg is placed on top of a light, vertical
spring of...
asked 10 months ago -
how do the kidneys compensate in the presences of acidosis
a) trigger hyperventilate
b) reserve acid...
asked 10 months ago -
Question 501 pts
The rental rate of capital to the firm increases. Which of the
following...
asked 10 months ago