

Homework Answers
Add Answer to:
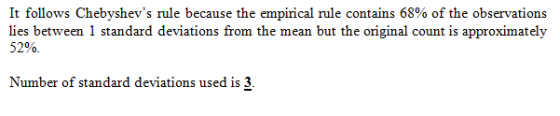
Is this set of data’s variance interpreted as empirical rule
or chebychev??? Please show computations and...
1. According to the empirical rule, in a normally distributed set of data, approximately what percent...
1. According to the empirical rule, in a normally distributed set of data, approximately what percent of the scores will be within 1 standard deviation (-1 to +1) away from the mean? 40% 95% 68% 75% 2. f you took an IQ test and your score was 2 standard deviations above average, assuming normal distribution, approximately what percent of all IQ test takers would your score be higher than? 98% 60% 70% 80% 3. if you took an IQ test...
Please help answer questions (a)-(c). Objective 4: Use the Empirical Rule to Describe Data That Are...
 Please help answer questions (a)-(c).
Objective 4: Use the Empirical Rule to Describe Data That Are Bell-Shaped 3.2 Measures of Dispersion 3.2.29 0 of 1 Point Scores of an IQ test have a bell-shaped distribution with a mean of 100 and a standard deviation of 11. Use the empirical rule to determine thefollowing (a) What percentage of people has an IQ score between 67 and 133? (b) What percentage of people has an IQ score less than 67 or greater...
Please help answer questions (a)-(c).
Objective 4: Use the Empirical Rule to Describe Data That Are Bell-Shaped 3.2 Measures of Dispersion 3.2.29 0 of 1 Point Scores of an IQ test have a bell-shaped distribution with a mean of 100 and a standard deviation of 11. Use the empirical rule to determine thefollowing (a) What percentage of people has an IQ score between 67 and 133? (b) What percentage of people has an IQ score less than 67 or greater...
please show steps. thank you. Use the Empirical Rule. The mean speed of a sample of...
please show steps. thank you. Use the Empirical Rule. The mean speed of a sample of vehicles along a stretch of highway is 64 miles per hour, with a standard deviation of 5 miles per hour. Estimate the percent of vehicles whose speeds are between 49 miles per hour and 79 miles per hour. (Assume the data set has a bell-shaped distribution.) Approximately nothing ___% of vehicles travel between 49 miles per hour and 79 miles per hour.
Please give answer and work to show how you got the answer. Use the Empirical Rule....
 Please give answer and work to show how you got the answer.
Use the Empirical Rule. The mean speed of a sample of vehicles along a stretch of highway is 63 miles per hour, with a standard deviation of 4 miles per hour. Estimate the percent of vehicles whose speeds are between 55 miles per hour and 71 miles per hour. (Assume the data set has a bell-shaped distribution.) Approximately % of vehicles travel between 55 miles per hour and...
Please give answer and work to show how you got the answer.
Use the Empirical Rule. The mean speed of a sample of vehicles along a stretch of highway is 63 miles per hour, with a standard deviation of 4 miles per hour. Estimate the percent of vehicles whose speeds are between 55 miles per hour and 71 miles per hour. (Assume the data set has a bell-shaped distribution.) Approximately % of vehicles travel between 55 miles per hour and...
1/22/2020 BSAD63220 Homework #3 Variance, St. Deviations, Z-scores, and Empirical Rule Show your work, do not...
 1/22/2020 BSAD63220 Homework #3 Variance, St. Deviations, Z-scores, and Empirical Rule Show your work, do not use a spread sheet. 1. Corn Production. The following data represent the number of corn plants in randomly sampled rows (a 17-foot by 5-inch strip) for various types of plot. Compute the sample variance and standard deviation for each type of plot. Which type has the most dispersion based upon the standard deviation? Plot type Sludge Plot Spring disk No till Spring Chisele Great...
-LEAVE ANSWERS OUT TO 4 DECIMAL PLACES - PLEASE SHOW WORK -EACH PART OF EACH QUESTION...
-LEAVE ANSWERS OUT TO 4 DECIMAL PLACES - PLEASE SHOW WORK -EACH PART OF EACH QUESTION IS WORTH 2 POINTS FOR A TOTAL OF 38 POINTS. 1. Bank account balance is an example of a variable that follows which scale of measurement? a. ratio scale b. interval scale c. nominal scale d. ordinal scale 2./The number of lighting deaths per state in the Midwest over 20 years is listed in the table below. We are interested...
averages he ool district, would the av sleading when a data set com ral tendency, does...
 averages he ool district, would the av sleading when a data set com ral tendency, does the distrihution,,川 110 haet 10. Find th If the salaries represented every leacher in the school distric Which measure of central tendency can he misleading one is comparing the measures of central tendenc 6 When skewness? Explain appr See page 170 for the answers r a recent year, the worth (in billions sample of the 10 wealthiest people under is shown 14, 12, 48,...
Please help me from f) to v) Need to show all your work to get full...
 Please help me from f) to v)
Need to show all your work to get full credit. No WORK, NO CREDIT For the following dada set find the followings: (Note: need to do appropriate estimations 100 pts Total) 1. d) Range (2 pts) h Coefficient of variance (5 pts) b) Median (2 pt) ) Mode (1 pt) g) Stand. Deviation (2 pt) a) Mean (5 pt) 0 Variance (8 pt) D Percentile of data value 2.5 (5 e) Mid-Range (2...
Please help me from f) to v)
Need to show all your work to get full credit. No WORK, NO CREDIT For the following dada set find the followings: (Note: need to do appropriate estimations 100 pts Total) 1. d) Range (2 pts) h Coefficient of variance (5 pts) b) Median (2 pt) ) Mode (1 pt) g) Stand. Deviation (2 pt) a) Mean (5 pt) 0 Variance (8 pt) D Percentile of data value 2.5 (5 e) Mid-Range (2...
 Please help answer questions (a)-(c).
Objective 4: Use the Empirical Rule to Describe Data That Are Bell-Shaped 3.2 Measures of Dispersion 3.2.29 0 of 1 Point Scores of an IQ test have a bell-shaped distribution with a mean of 100 and a standard deviation of 11. Use the empirical rule to determine thefollowing (a) What percentage of people has an IQ score between 67 and 133? (b) What percentage of people has an IQ score less than 67 or greater...
Please help answer questions (a)-(c).
Objective 4: Use the Empirical Rule to Describe Data That Are Bell-Shaped 3.2 Measures of Dispersion 3.2.29 0 of 1 Point Scores of an IQ test have a bell-shaped distribution with a mean of 100 and a standard deviation of 11. Use the empirical rule to determine thefollowing (a) What percentage of people has an IQ score between 67 and 133? (b) What percentage of people has an IQ score less than 67 or greater...
 Please give answer and work to show how you got the answer.
Use the Empirical Rule. The mean speed of a sample of vehicles along a stretch of highway is 63 miles per hour, with a standard deviation of 4 miles per hour. Estimate the percent of vehicles whose speeds are between 55 miles per hour and 71 miles per hour. (Assume the data set has a bell-shaped distribution.) Approximately % of vehicles travel between 55 miles per hour and...
Please give answer and work to show how you got the answer.
Use the Empirical Rule. The mean speed of a sample of vehicles along a stretch of highway is 63 miles per hour, with a standard deviation of 4 miles per hour. Estimate the percent of vehicles whose speeds are between 55 miles per hour and 71 miles per hour. (Assume the data set has a bell-shaped distribution.) Approximately % of vehicles travel between 55 miles per hour and...
 1/22/2020 BSAD63220 Homework #3 Variance, St. Deviations, Z-scores, and Empirical Rule Show your work, do not use a spread sheet. 1. Corn Production. The following data represent the number of corn plants in randomly sampled rows (a 17-foot by 5-inch strip) for various types of plot. Compute the sample variance and standard deviation for each type of plot. Which type has the most dispersion based upon the standard deviation? Plot type Sludge Plot Spring disk No till Spring Chisele Great...
 averages he ool district, would the av sleading when a data set com ral tendency, does the distrihution,,川 110 haet 10. Find th If the salaries represented every leacher in the school distric Which measure of central tendency can he misleading one is comparing the measures of central tendenc 6 When skewness? Explain appr See page 170 for the answers r a recent year, the worth (in billions sample of the 10 wealthiest people under is shown 14, 12, 48,...
 Please help me from f) to v)
Need to show all your work to get full credit. No WORK, NO CREDIT For the following dada set find the followings: (Note: need to do appropriate estimations 100 pts Total) 1. d) Range (2 pts) h Coefficient of variance (5 pts) b) Median (2 pt) ) Mode (1 pt) g) Stand. Deviation (2 pt) a) Mean (5 pt) 0 Variance (8 pt) D Percentile of data value 2.5 (5 e) Mid-Range (2...
Please help me from f) to v)
Need to show all your work to get full credit. No WORK, NO CREDIT For the following dada set find the followings: (Note: need to do appropriate estimations 100 pts Total) 1. d) Range (2 pts) h Coefficient of variance (5 pts) b) Median (2 pt) ) Mode (1 pt) g) Stand. Deviation (2 pt) a) Mean (5 pt) 0 Variance (8 pt) D Percentile of data value 2.5 (5 e) Mid-Range (2...
Most questions answered within 3 hours.
-
Where is the error in this code sequence?
String s1 = "Hello";
String s2 = "ello";...
asked 10 months ago -
Financial data for Joel de Paris, Inc., for last year
follow:
Joel de Paris, Inc.
Balance...
asked 10 months ago -
Consider this reaction:
Al2(SO4)3 (aq)+ BaCl3
(aq) Al2Cl6 (aq)- +
3BaSO4(s) . What is the...
asked 10 months ago -
Suppose that Savneet is considering increasing her
recent random sample from 20 car rentals to 40...
asked 10 months ago -
Trucks arrive at an unloading terminal at an average rate of 120
per hour.
Trucks arrive...
asked 10 months ago -
Why are methanol and ethanol completely soluble in water while
octanol is not very little soluble....
asked 10 months ago -
A facilities manager at a university reads in a research report
that the mean amount of...
asked 10 months ago -
When the CuSO4 is rehydrated by adding water to the anhydrous
compound, is this an endothermic...
asked 10 months ago -
A ray of sunlight is passing from diamond into crown glass; the
angle of incidence is...
asked 10 months ago -
A block of mass 0.249 kg is placed on top of a light, vertical
spring of...
asked 10 months ago -
how do the kidneys compensate in the presences of acidosis
a) trigger hyperventilate
b) reserve acid...
asked 10 months ago -
Question 501 pts
The rental rate of capital to the firm increases. Which of the
following...
asked 10 months ago