Appreciate if you can answer this ONE QUESTION COMPLETELY and give me a detailed working with explanation for me to understand. Once completed so long as my doubts are cleared and the solutions are correct, I will definitely vote up. Some of the question are similiar to take a look carefully before you answer as it's very important for me.
Thank you.
Homework Answers
(a)
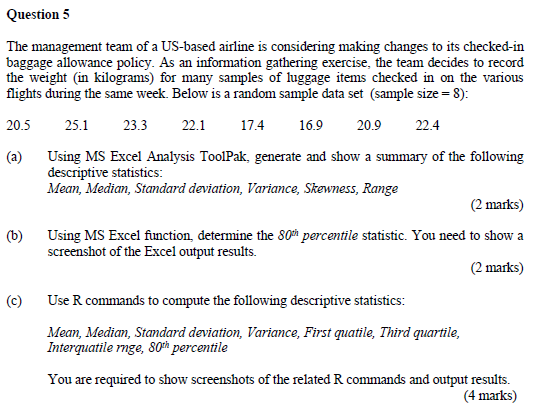
To generate descriptive statistics for these scores, execute the following steps.
1. On the Data tab, in the Analysis group, click Data Analysis.

2. Select Descriptive Statistics and click OK.

3. Select the range A2:A8 as the Input Range.
4. Select cell C1 as the Output Range.
5. Make sure Summary statistics is checked.
6. Click OK.
Result:

You can get all the descriptive statistics in the output.
(b)
Write the below command in any cell of the excel. Note the data is from the cell A1 to A8.
=PERCENTILE(A1:A8, 0.8)
You will get the output as 22.94

(c)
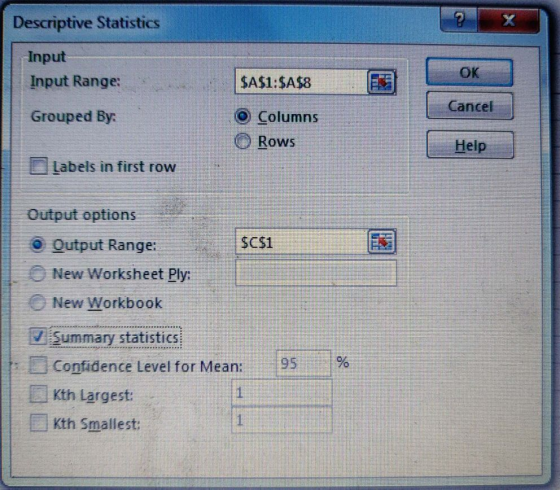
Run the below commands in R to get the descriptive statistics. The output is shown below.
![x-c(20.5,25 . 1,23 .3 ,22.1,17.4,16 . 9, 20. 9, 22, 4) summary(X) #Give the 5 point summary sd(x) #Store the value of data 2 #Standard deviation #Variance 4 var(x) 5 summary(x)[5] - summary(x)C2] IQR quantile(x,0.8) #80th percentile 7](http://img.homeworklib.com/questions/625bed50-71e7-11ea-be5c-53d9c99dfd56.png?x-oss-process=image/resize,w_560)
On running the command, we get the below output.
> x = c(20.5,25.1,23.3,22.1,17.4,16.9,20.9,22.4) #Store the value of data
> summary(x) #Give the 5 point summary
Min. 1st Qu. Median Mean 3rd Qu. Max.
16.90 19.73 21.50 21.08 22.62 25.10
> sd(x) #Standard deviation
[1] 2.80955
> var(x) #Variance
[1] 7.893571
> summary(x)[5] - summary(x)[2] #IQR = 3rd quartile - 1st
Quartile
IQR
2.89
> quantile(x,0.8) #80th percentile
80%
22.94
>
Add Answer to:
Appreciate if you can answer this ONE QUESTION
COMPLETELY and give me a detailed working with...
Appreciate if you can answer this ONE QUESTION COMPLETELY and give me a detailed working with...
 Appreciate if you can answer this ONE QUESTION
COMPLETELY and give me a detailed working with explanation
for me to understand. Once completed so long as my doubts are
cleared and the solutions are correct, I will definitely vote up.
Some of the question are similiar to take a look carefully before
you answer as it's very important for me.
Thank you.
Question 4 (a) Suppose that the length of time t (in days) between sales for an automobile salesperson...
Appreciate if you can answer this ONE QUESTION
COMPLETELY and give me a detailed working with explanation
for me to understand. Once completed so long as my doubts are
cleared and the solutions are correct, I will definitely vote up.
Some of the question are similiar to take a look carefully before
you answer as it's very important for me.
Thank you.
Question 4 (a) Suppose that the length of time t (in days) between sales for an automobile salesperson...
Appreciate if you can answer this ONE QUESTION COMPLETELY and give me a detailed working with...
 Appreciate if you can answer this ONE QUESTION
COMPLETELY and give me a detailed working with explanation
for me to understand. Once completed so long as my doubts are
cleared and the solutions are correct, I will definitely vote up.
Some of the question are similiar to take a look carefully before
you answer as it's very important for me.
Thank you
Question 2 (a) Identify the mean and variance of a standard normal random variable Z. Determine the following...
Appreciate if you can answer this ONE QUESTION
COMPLETELY and give me a detailed working with explanation
for me to understand. Once completed so long as my doubts are
cleared and the solutions are correct, I will definitely vote up.
Some of the question are similiar to take a look carefully before
you answer as it's very important for me.
Thank you
Question 2 (a) Identify the mean and variance of a standard normal random variable Z. Determine the following...
Appreciate if you can answer this ONE QUESTION COMPLETELY and give me a detailed working with...
 Appreciate if you can answer this ONE QUESTION
COMPLETELY and give me a detailed working with explanation
for me to understand. Once completed so long as my doubts are
cleared and the solutions are correct, I will definitely vote up.
Some of the question are similiar to take a look carefully before
you answer as it's very important for me.
Thank you
Question 1 A laboratory test is 95 % correct in detecting a certain disease when the disease is...
Appreciate if you can answer this ONE QUESTION
COMPLETELY and give me a detailed working with explanation
for me to understand. Once completed so long as my doubts are
cleared and the solutions are correct, I will definitely vote up.
Some of the question are similiar to take a look carefully before
you answer as it's very important for me.
Thank you
Question 1 A laboratory test is 95 % correct in detecting a certain disease when the disease is...
Appreciate if you can answer this QUESTION COMPLETELY and give me a detailed working with explanation...
 Appreciate if you can answer this QUESTION
COMPLETELY and give me a detailed working with explanation
for me to understand. Once completed so long as my doubts are
cleared and the solutions are correct, I will definitely vote
up.
Thank you.
Question 5 A chemical engineer carried out several batches of experiments to evaluate two types of catalysts. The objective is to determine whether catalyst B produces higher mean process yield than catalyst A. In this case, a random sample...
Appreciate if you can answer this QUESTION
COMPLETELY and give me a detailed working with explanation
for me to understand. Once completed so long as my doubts are
cleared and the solutions are correct, I will definitely vote
up.
Thank you.
Question 5 A chemical engineer carried out several batches of experiments to evaluate two types of catalysts. The objective is to determine whether catalyst B produces higher mean process yield than catalyst A. In this case, a random sample...
Appreciate if you can answer this QUESTION COMPLETELY and give me a detailed working with explanation...
 Appreciate if you can answer this QUESTION
COMPLETELY and give me a detailed working with explanation
for me to understand. Once completed so long as my doubts are
cleared and the solutions are correct, I will definitely vote
up.
This question is related to STATISTICAL METHODS AND
INFERENCE
Thank you.
Question 1 (6) A study is conducted to examine the effects of educational level on the productivity performance level of a group of employees in a company. The data is...
Appreciate if you can answer this QUESTION
COMPLETELY and give me a detailed working with explanation
for me to understand. Once completed so long as my doubts are
cleared and the solutions are correct, I will definitely vote
up.
This question is related to STATISTICAL METHODS AND
INFERENCE
Thank you.
Question 1 (6) A study is conducted to examine the effects of educational level on the productivity performance level of a group of employees in a company. The data is...
Hi! Can someone please help me with the following question? If you can show all your...
 Hi!
Can someone please help me with the following question? If you
can show all your steps so I can understand the solution I would
really appreciate it!
Thanks :)
2- Below you can find scores of a test: {56,67,67,70,73,73,75,76,77,79,80,81,83,83,85,87,88,89,92,93 } (a) Obtain a frequency distribution for the test. (The number of bins and intervals should be determined according to the rules in the class slides). (b) Draw a frequency histogram. (c) Use the frequency distribution to compute the...
Hi!
Can someone please help me with the following question? If you
can show all your steps so I can understand the solution I would
really appreciate it!
Thanks :)
2- Below you can find scores of a test: {56,67,67,70,73,73,75,76,77,79,80,81,83,83,85,87,88,89,92,93 } (a) Obtain a frequency distribution for the test. (The number of bins and intervals should be determined according to the rules in the class slides). (b) Draw a frequency histogram. (c) Use the frequency distribution to compute the...
Can you please show me all the steps with formula how to get to the correct answer? Also can you show me to how to get t...
 Can you please show me all the steps with formula how to get to
the correct answer? Also can you show me to how to get to the
answer on calculator as well?
Question 5 0 out of 1 points In swimming, clearly you would like to swim fast, but swimming consistent times is also important. A survey of 30 swims by men on a local university's swim team found a variance of their swimming times was 9. A similar...
Can you please show me all the steps with formula how to get to
the correct answer? Also can you show me to how to get to the
answer on calculator as well?
Question 5 0 out of 1 points In swimming, clearly you would like to swim fast, but swimming consistent times is also important. A survey of 30 swims by men on a local university's swim team found a variance of their swimming times was 9. A similar...
Hi, can you solve the question for me step by step, I will rate up if the working is correct. I will post the answer together with the question. Answer: Question 5 This problem analyzes projectile m...
 Hi, can you solve the question for me step by step, I will rate
up if the working is correct. I will post the answer together with
the question.
Answer:
Question 5 This problem analyzes projectile motion. A netball player throws the ball from a point 4.5 metre horizontally from the net as shown in Figure Q5. The ball is thrown witha speed of 9 ms-1 at an angle of projection of α to the horizontal. Assume the acceleration due...
Hi, can you solve the question for me step by step, I will rate
up if the working is correct. I will post the answer together with
the question.
Answer:
Question 5 This problem analyzes projectile motion. A netball player throws the ball from a point 4.5 metre horizontally from the net as shown in Figure Q5. The ball is thrown witha speed of 9 ms-1 at an angle of projection of α to the horizontal. Assume the acceleration due...
Please help me answer this question for my Analytic Chemistry subject. PLEASE answer it seriously and completely, or better not answer it if not then, really appreciate it, thank you. 2. (a) The f...
 Please help me answer this question for my Analytic Chemistry
subject. PLEASE answer it seriously and completely, or better not
answer it if not then, really appreciate it, thank you.
2. (a) The following standard solutions were used in determining Al in an aqueous solution. A flame atomic emission spectrometer was used. Solution Al concentration (ppb)Emission reading Standard solution 1 1.0 0.45 Standard solution 2 10.0 4.05 20.0 Standard solution 3 8.55 Standard solution 4 50.0 22.15 44.05 Standard solution5...
Please help me answer this question for my Analytic Chemistry
subject. PLEASE answer it seriously and completely, or better not
answer it if not then, really appreciate it, thank you.
2. (a) The following standard solutions were used in determining Al in an aqueous solution. A flame atomic emission spectrometer was used. Solution Al concentration (ppb)Emission reading Standard solution 1 1.0 0.45 Standard solution 2 10.0 4.05 20.0 Standard solution 3 8.55 Standard solution 4 50.0 22.15 44.05 Standard solution5...
Please help me answer this question for my Statistical Methods subject. PLEASE answer it seriously and completely, or be...
 Please help me answer this question for my Statistical Methods
subject. PLEASE answer it seriously and completely, or better not
answer it if not then, really appreciate it, thank you.
5. (a) Explain briefly the difference between fixed effects model and random effects model in the one-way analysis of variance Give the hypothesis of random effects model in the one-way analysis of variance. (11 (20 marks) (b) Eight music videos were ranked by teenagers and their parents on style and...
Please help me answer this question for my Statistical Methods
subject. PLEASE answer it seriously and completely, or better not
answer it if not then, really appreciate it, thank you.
5. (a) Explain briefly the difference between fixed effects model and random effects model in the one-way analysis of variance Give the hypothesis of random effects model in the one-way analysis of variance. (11 (20 marks) (b) Eight music videos were ranked by teenagers and their parents on style and...
 Appreciate if you can answer this ONE QUESTION
COMPLETELY and give me a detailed working with explanation
for me to understand. Once completed so long as my doubts are
cleared and the solutions are correct, I will definitely vote up.
Some of the question are similiar to take a look carefully before
you answer as it's very important for me.
Thank you.
Question 4 (a) Suppose that the length of time t (in days) between sales for an automobile salesperson...
Appreciate if you can answer this ONE QUESTION
COMPLETELY and give me a detailed working with explanation
for me to understand. Once completed so long as my doubts are
cleared and the solutions are correct, I will definitely vote up.
Some of the question are similiar to take a look carefully before
you answer as it's very important for me.
Thank you.
Question 4 (a) Suppose that the length of time t (in days) between sales for an automobile salesperson...
 Appreciate if you can answer this ONE QUESTION
COMPLETELY and give me a detailed working with explanation
for me to understand. Once completed so long as my doubts are
cleared and the solutions are correct, I will definitely vote up.
Some of the question are similiar to take a look carefully before
you answer as it's very important for me.
Thank you
Question 2 (a) Identify the mean and variance of a standard normal random variable Z. Determine the following...
Appreciate if you can answer this ONE QUESTION
COMPLETELY and give me a detailed working with explanation
for me to understand. Once completed so long as my doubts are
cleared and the solutions are correct, I will definitely vote up.
Some of the question are similiar to take a look carefully before
you answer as it's very important for me.
Thank you
Question 2 (a) Identify the mean and variance of a standard normal random variable Z. Determine the following...
 Appreciate if you can answer this ONE QUESTION
COMPLETELY and give me a detailed working with explanation
for me to understand. Once completed so long as my doubts are
cleared and the solutions are correct, I will definitely vote up.
Some of the question are similiar to take a look carefully before
you answer as it's very important for me.
Thank you
Question 1 A laboratory test is 95 % correct in detecting a certain disease when the disease is...
Appreciate if you can answer this ONE QUESTION
COMPLETELY and give me a detailed working with explanation
for me to understand. Once completed so long as my doubts are
cleared and the solutions are correct, I will definitely vote up.
Some of the question are similiar to take a look carefully before
you answer as it's very important for me.
Thank you
Question 1 A laboratory test is 95 % correct in detecting a certain disease when the disease is...
 Appreciate if you can answer this QUESTION
COMPLETELY and give me a detailed working with explanation
for me to understand. Once completed so long as my doubts are
cleared and the solutions are correct, I will definitely vote
up.
Thank you.
Question 5 A chemical engineer carried out several batches of experiments to evaluate two types of catalysts. The objective is to determine whether catalyst B produces higher mean process yield than catalyst A. In this case, a random sample...
Appreciate if you can answer this QUESTION
COMPLETELY and give me a detailed working with explanation
for me to understand. Once completed so long as my doubts are
cleared and the solutions are correct, I will definitely vote
up.
Thank you.
Question 5 A chemical engineer carried out several batches of experiments to evaluate two types of catalysts. The objective is to determine whether catalyst B produces higher mean process yield than catalyst A. In this case, a random sample...
 Appreciate if you can answer this QUESTION
COMPLETELY and give me a detailed working with explanation
for me to understand. Once completed so long as my doubts are
cleared and the solutions are correct, I will definitely vote
up.
This question is related to STATISTICAL METHODS AND
INFERENCE
Thank you.
Question 1 (6) A study is conducted to examine the effects of educational level on the productivity performance level of a group of employees in a company. The data is...
Appreciate if you can answer this QUESTION
COMPLETELY and give me a detailed working with explanation
for me to understand. Once completed so long as my doubts are
cleared and the solutions are correct, I will definitely vote
up.
This question is related to STATISTICAL METHODS AND
INFERENCE
Thank you.
Question 1 (6) A study is conducted to examine the effects of educational level on the productivity performance level of a group of employees in a company. The data is...
 Hi!
Can someone please help me with the following question? If you
can show all your steps so I can understand the solution I would
really appreciate it!
Thanks :)
2- Below you can find scores of a test: {56,67,67,70,73,73,75,76,77,79,80,81,83,83,85,87,88,89,92,93 } (a) Obtain a frequency distribution for the test. (The number of bins and intervals should be determined according to the rules in the class slides). (b) Draw a frequency histogram. (c) Use the frequency distribution to compute the...
Hi!
Can someone please help me with the following question? If you
can show all your steps so I can understand the solution I would
really appreciate it!
Thanks :)
2- Below you can find scores of a test: {56,67,67,70,73,73,75,76,77,79,80,81,83,83,85,87,88,89,92,93 } (a) Obtain a frequency distribution for the test. (The number of bins and intervals should be determined according to the rules in the class slides). (b) Draw a frequency histogram. (c) Use the frequency distribution to compute the...
 Can you please show me all the steps with formula how to get to
the correct answer? Also can you show me to how to get to the
answer on calculator as well?
Question 5 0 out of 1 points In swimming, clearly you would like to swim fast, but swimming consistent times is also important. A survey of 30 swims by men on a local university's swim team found a variance of their swimming times was 9. A similar...
Can you please show me all the steps with formula how to get to
the correct answer? Also can you show me to how to get to the
answer on calculator as well?
Question 5 0 out of 1 points In swimming, clearly you would like to swim fast, but swimming consistent times is also important. A survey of 30 swims by men on a local university's swim team found a variance of their swimming times was 9. A similar...
 Hi, can you solve the question for me step by step, I will rate
up if the working is correct. I will post the answer together with
the question.
Answer:
Question 5 This problem analyzes projectile motion. A netball player throws the ball from a point 4.5 metre horizontally from the net as shown in Figure Q5. The ball is thrown witha speed of 9 ms-1 at an angle of projection of α to the horizontal. Assume the acceleration due...
Hi, can you solve the question for me step by step, I will rate
up if the working is correct. I will post the answer together with
the question.
Answer:
Question 5 This problem analyzes projectile motion. A netball player throws the ball from a point 4.5 metre horizontally from the net as shown in Figure Q5. The ball is thrown witha speed of 9 ms-1 at an angle of projection of α to the horizontal. Assume the acceleration due...
 Please help me answer this question for my Analytic Chemistry
subject. PLEASE answer it seriously and completely, or better not
answer it if not then, really appreciate it, thank you.
2. (a) The following standard solutions were used in determining Al in an aqueous solution. A flame atomic emission spectrometer was used. Solution Al concentration (ppb)Emission reading Standard solution 1 1.0 0.45 Standard solution 2 10.0 4.05 20.0 Standard solution 3 8.55 Standard solution 4 50.0 22.15 44.05 Standard solution5...
Please help me answer this question for my Analytic Chemistry
subject. PLEASE answer it seriously and completely, or better not
answer it if not then, really appreciate it, thank you.
2. (a) The following standard solutions were used in determining Al in an aqueous solution. A flame atomic emission spectrometer was used. Solution Al concentration (ppb)Emission reading Standard solution 1 1.0 0.45 Standard solution 2 10.0 4.05 20.0 Standard solution 3 8.55 Standard solution 4 50.0 22.15 44.05 Standard solution5...
 Please help me answer this question for my Statistical Methods
subject. PLEASE answer it seriously and completely, or better not
answer it if not then, really appreciate it, thank you.
5. (a) Explain briefly the difference between fixed effects model and random effects model in the one-way analysis of variance Give the hypothesis of random effects model in the one-way analysis of variance. (11 (20 marks) (b) Eight music videos were ranked by teenagers and their parents on style and...
Please help me answer this question for my Statistical Methods
subject. PLEASE answer it seriously and completely, or better not
answer it if not then, really appreciate it, thank you.
5. (a) Explain briefly the difference between fixed effects model and random effects model in the one-way analysis of variance Give the hypothesis of random effects model in the one-way analysis of variance. (11 (20 marks) (b) Eight music videos were ranked by teenagers and their parents on style and...
Most questions answered within 3 hours.
-
Where is the error in this code sequence?
String s1 = "Hello";
String s2 = "ello";...
asked 10 months ago -
Financial data for Joel de Paris, Inc., for last year
follow:
Joel de Paris, Inc.
Balance...
asked 10 months ago -
Consider this reaction:
Al2(SO4)3 (aq)+ BaCl3
(aq) Al2Cl6 (aq)- +
3BaSO4(s) . What is the...
asked 10 months ago -
Suppose that Savneet is considering increasing her
recent random sample from 20 car rentals to 40...
asked 10 months ago -
Trucks arrive at an unloading terminal at an average rate of 120
per hour.
Trucks arrive...
asked 10 months ago -
Why are methanol and ethanol completely soluble in water while
octanol is not very little soluble....
asked 10 months ago -
A facilities manager at a university reads in a research report
that the mean amount of...
asked 10 months ago -
When the CuSO4 is rehydrated by adding water to the anhydrous
compound, is this an endothermic...
asked 10 months ago -
A ray of sunlight is passing from diamond into crown glass; the
angle of incidence is...
asked 10 months ago -
A block of mass 0.249 kg is placed on top of a light, vertical
spring of...
asked 10 months ago -
how do the kidneys compensate in the presences of acidosis
a) trigger hyperventilate
b) reserve acid...
asked 10 months ago -
Question 501 pts
The rental rate of capital to the firm increases. Which of the
following...
asked 10 months ago