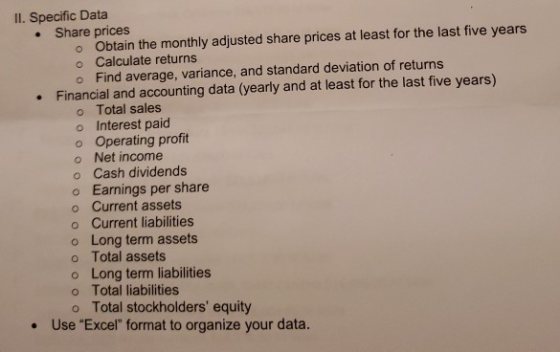
Good evening, I have to do a Research Project for my finance class, the teacher asks me to look for the data I provide about Dell Technologies. Could you help me? Thank you very much in advance.
Homework Answers
Share Price
Please know data prior to 08/01/2016 is not available on yahoo finance, to I have taken data from Aug 2016 to Oct 2019
Average Return - Average of Returns = 2.4%
Variance - Sum of (Returns - Average Returns)^2 = 28.86%
Standard Deviation is square root of (Variance / n-1) =0.8831
Find the excel
| Date | Price | Returns | Returns - Average Returns | (Returns - Average Returns)^2 |
| 01-08-2016 | 24.74 | |||
| 01-09-2016 | 26.47 | 6.98% | 4.58% | 0.21% |
| 01-10-2016 | 27.18 | 2.70% | 0.30% | 0.00% |
| 01-11-2016 | 29.66 | 9.11% | 6.70% | 0.45% |
| 01-12-2016 | 30.44 | 2.63% | 0.23% | 0.00% |
| 01-01-2017 | 34.88 | 14.59% | 12.19% | 1.49% |
| 01-02-2017 | 35.16 | 0.79% | -1.61% | 0.03% |
| 01-03-2017 | 35.48 | 0.93% | -1.47% | 0.02% |
| 01-04-2017 | 37.16 | 4.73% | 2.33% | 0.05% |
| 01-05-2017 | 38.42 | 3.40% | 1.00% | 0.01% |
| 01-06-2017 | 33.84 | -11.93% | -14.33% | 2.05% |
| 01-07-2017 | 35.59 | 5.17% | 2.77% | 0.08% |
| 01-08-2017 | 41.49 | 16.59% | 14.19% | 2.01% |
| 01-09-2017 | 42.75 | 3.04% | 0.64% | 0.00% |
| 01-10-2017 | 45.83 | 7.20% | 4.80% | 0.23% |
| 01-11-2017 | 43.32 | -5.47% | -7.87% | 0.62% |
| 01-12-2017 | 45.01 | 3.89% | 1.48% | 0.02% |
| 01-01-2018 | 39.70 | -11.79% | -14.19% | 2.01% |
| 01-02-2018 | 41.14 | 3.61% | 1.21% | 0.01% |
| 01-03-2018 | 40.54 | -1.45% | -3.85% | 0.15% |
| 01-04-2018 | 39.74 | -1.97% | -4.37% | 0.19% |
| 01-05-2018 | 44.66 | 12.39% | 9.99% | 1.00% |
| 01-06-2018 | 46.83 | 4.86% | 2.46% | 0.06% |
| 01-07-2018 | 51.23 | 9.39% | 6.99% | 0.49% |
| 01-08-2018 | 53.25 | 3.95% | 1.54% | 0.02% |
| 01-09-2018 | 53.78 | 0.99% | -1.41% | 0.02% |
| 01-10-2018 | 50.05 | -6.93% | -9.33% | 0.87% |
| 01-11-2018 | 58.41 | 16.69% | 14.29% | 2.04% |
| 01-12-2018 | 48.87 | -16.33% | -18.73% | 3.51% |
| 01-01-2019 | 48.59 | -0.57% | -2.97% | 0.09% |
| 01-02-2019 | 55.82 | 14.88% | 12.48% | 1.56% |
| 01-03-2019 | 58.69 | 5.14% | 2.74% | 0.08% |
| 01-04-2019 | 67.41 | 14.86% | 12.46% | 1.55% |
| 01-05-2019 | 59.55 | -11.66% | -14.06% | 1.98% |
| 01-06-2019 | 50.80 | -14.69% | -17.09% | 2.92% |
| 01-07-2019 | 57.74 | 13.66% | 11.26% | 1.27% |
| 01-08-2019 | 51.53 | -10.76% | -13.16% | 1.73% |
| 01-09-2019 | 51.86 | 0.64% | -1.76% | 0.03% |
| 01-10-2019 | 52.89 | 1.99% | -0.41% | 0.00% |
| Average Return - Average of Returns | 2.40% | |||
| Variance - Sum of (Returns - Average Returns)^2 | 28.86% | |||
| Standard Deviation is square root of Variance / n-1 | 0.8831 | |||
Please know I won't be able to do next question due to space constraints so I would request you to re post only next question for Dell Technologies.
Thanks and Have a nice day
Add Answer to:
Good evening, I have to do a Research Project for my
finance class, the teacher asks...
Good night, I have this second part of a research paper for my Finance class but...
 Good night, I have this second part of a research
paper for my Finance class but I do not understand what I should do
or know how to start. Could you help me? Thanks a lot. By the way
the work is from the Dell and Lenovo companies.
RESEARCH PART II FIN II From the data obtained in Research I. • Trend Analysis o Risk analysis . Business risk: • type of industry, • the variability of the firm's operating...
Good night, I have this second part of a research
paper for my Finance class but I do not understand what I should do
or know how to start. Could you help me? Thanks a lot. By the way
the work is from the Dell and Lenovo companies.
RESEARCH PART II FIN II From the data obtained in Research I. • Trend Analysis o Risk analysis . Business risk: • type of industry, • the variability of the firm's operating...
I don't know what I have left out, maybe my numbers are wrong but I have...
 I don't know what I have left
out, maybe my numbers are wrong but I have not a clue what I did
wrong. Can someone help me understand what is wrong and help?
The following are the transactions of Spotlighter, Inc., for the month of January. a. Borrowed $4,340 from a local bank on a note due in six months. b. Received $5,030 cash from investors and issued common stock to them. c. Purchased $1,400 in equipment, paying $400 cash...
I don't know what I have left
out, maybe my numbers are wrong but I have not a clue what I did
wrong. Can someone help me understand what is wrong and help?
The following are the transactions of Spotlighter, Inc., for the month of January. a. Borrowed $4,340 from a local bank on a note due in six months. b. Received $5,030 cash from investors and issued common stock to them. c. Purchased $1,400 in equipment, paying $400 cash...
I am working on doing an analysis of a company for my accounting class. can you...
 I am working on doing an analysis of a company for my accounting
class. can you please review what I have and correct what I have
wrong. Also, Help me with the ones I have left blank as I can not
find the right information to solve these. Thank you so much!!
Ratio:
Formula:
Year:
Formula:
Total:
Current Ratio:
Current Assets / Current Liabilities
2018
566,951 / 379,743
1.49
Acid-Test Ratio
Cash + Short- Term Investments + Current Receivables /...
I am working on doing an analysis of a company for my accounting
class. can you please review what I have and correct what I have
wrong. Also, Help me with the ones I have left blank as I can not
find the right information to solve these. Thank you so much!!
Ratio:
Formula:
Year:
Formula:
Total:
Current Ratio:
Current Assets / Current Liabilities
2018
566,951 / 379,743
1.49
Acid-Test Ratio
Cash + Short- Term Investments + Current Receivables /...
Please give me a brief explanation, i do not understand finance!!! Have a great day/night How...
 Please give me a brief explanation, i do not understand
finance!!! Have a great day/night
How do i calculate:
1. DPS for 2010, question one.
2. Financial structure for question two.
option XYZ CORPORATION Balance Sheet as of December 31 2009 and 2010 (In thousands of Dollars) Assets 2009 2010 Current Assets: Cash and marketable securities Accounts receivable $2,760 7,230 $2,760 7,650 Total Fixed Assets: 21,240 22,260 Gross Plant and equipment Less: Depreciation Net Plant and equipment 33,750 4,500 40,800...
Please give me a brief explanation, i do not understand
finance!!! Have a great day/night
How do i calculate:
1. DPS for 2010, question one.
2. Financial structure for question two.
option XYZ CORPORATION Balance Sheet as of December 31 2009 and 2010 (In thousands of Dollars) Assets 2009 2010 Current Assets: Cash and marketable securities Accounts receivable $2,760 7,230 $2,760 7,650 Total Fixed Assets: 21,240 22,260 Gross Plant and equipment Less: Depreciation Net Plant and equipment 33,750 4,500 40,800...
i need help on my retained earnings and income statement. i have a income tax rate...
 i need help on my retained earnings and income statement. i
have a income tax rate of 20% and my RE ending has to be 361,000.
not sure what i am missing on my income statement
here are some updated pictures
We were unable to transcribe this imageWe were unable to transcribe this imageWe were unable to transcribe this image17000 75000 25000 117000 50000 150000 400000 Liabilities and Shareholders' Equity Current Liabilities: Accounts Payable Income Tax Payable t Payable Current...
i need help on my retained earnings and income statement. i
have a income tax rate of 20% and my RE ending has to be 361,000.
not sure what i am missing on my income statement
here are some updated pictures
We were unable to transcribe this imageWe were unable to transcribe this imageWe were unable to transcribe this image17000 75000 25000 117000 50000 150000 400000 Liabilities and Shareholders' Equity Current Liabilities: Accounts Payable Income Tax Payable t Payable Current...
Dear Finance Experts, please help me I need the solution for this question as soon as...
Dear Finance Experts, please help me I need the solution for this question as soon as possible, I know you might be busy but please don't ignore my assignment! I posted it before 7 hours and it is still not answered yet, now I post it again to notify you again. "Please, I need someone to help me solve this problem for the last four fiscal years ( 2015, 2016,2017, and 2018) as soon as possible! Data Cases This is...
Please include steps. (calculate for both 2010 & 2011) I have attached all financial statements Annual...
 Please include steps. (calculate for both 2010 &
2011)
I have attached all financial statements
Annual Data 1 Millions of US $ except per share data 2011-09-30 2010-09-30 2009 Revenue Cost Of Goods Sold Gross Profit $108,249 $64,431 $43,818 $2,429 $7,599 $65,225 $39,541 $25,684 $1,782 $5,517 $74,459 $33,790 $415 $34,205 $8,283 $25,922 EEEEE EE EE E E E E E E E E E E Research And Development Expenses SG&A Expenses Other Operating Income Or Expenses Operating Expenses Operating Income...
Please include steps. (calculate for both 2010 &
2011)
I have attached all financial statements
Annual Data 1 Millions of US $ except per share data 2011-09-30 2010-09-30 2009 Revenue Cost Of Goods Sold Gross Profit $108,249 $64,431 $43,818 $2,429 $7,599 $65,225 $39,541 $25,684 $1,782 $5,517 $74,459 $33,790 $415 $34,205 $8,283 $25,922 EEEEE EE EE E E E E E E E E E E Research And Development Expenses SG&A Expenses Other Operating Income Or Expenses Operating Expenses Operating Income...
Hello, I have this exercise from my Investment class but I need to know the procedure...
 Hello, I have this exercise from my Investment class
but I need to know the procedure of how to reach the results. Could
you help me? Thank you.
Last year ABC company had the following data Net Sales million) # 1,200 Cost of G . Sold 780 Gross Profit Margin na 420 Depreciation 0. Expences 120 Adm. Expences 129 Operating Profit Interest Profit Before Tax Taxes Net Income Cash 200 3000 900 A keceivables inventory Net fixed assets Notes payable...
Hello, I have this exercise from my Investment class
but I need to know the procedure of how to reach the results. Could
you help me? Thank you.
Last year ABC company had the following data Net Sales million) # 1,200 Cost of G . Sold 780 Gross Profit Margin na 420 Depreciation 0. Expences 120 Adm. Expences 129 Operating Profit Interest Profit Before Tax Taxes Net Income Cash 200 3000 900 A keceivables inventory Net fixed assets Notes payable...
Do i to m provide formulas 17-2 Financial Ratios The annual reports of Milano Italian clothing...
 Do i to m provide formulas
17-2 Financial Ratios The annual reports of Milano Italian clothing chain e d the low e steldea in millions, is the European cure FEES € 95" € 29 RS 62 350 165 20x2 20x1 2 0KO Annual amounts: Net income Gross margin on sales 250 Cost of goods sold Operating expenses 295 Income tax expose Dividends declared and paid End-of-year amounts Long-term assets Long-term debt Current liabilities Cash Accounts receivable 78 Merchandise 68 Paid-in...
Do i to m provide formulas
17-2 Financial Ratios The annual reports of Milano Italian clothing chain e d the low e steldea in millions, is the European cure FEES € 95" € 29 RS 62 350 165 20x2 20x1 2 0KO Annual amounts: Net income Gross margin on sales 250 Cost of goods sold Operating expenses 295 Income tax expose Dividends declared and paid End-of-year amounts Long-term assets Long-term debt Current liabilities Cash Accounts receivable 78 Merchandise 68 Paid-in...
corporate Finance NU REYS (3) - Protected View - Last saved by user . Saved to...
 corporate Finance NU REYS (3) - Protected View - Last saved by user . Saved to this PC W Be careful--files from the Internet can contain viruses. Unless you need to edit, it's safer to stay in Protected View Enable Editing Question 14_Calculate the capital expenditure, Free Cash Flow to Equity (FCFE) and FCFE per share for year 2000 (5 points) • What are year 2000's capital expenditures? Show your calcualtion (2 points) • Free Cash Flow to Equity for...
 Good night, I have this second part of a research
paper for my Finance class but I do not understand what I should do
or know how to start. Could you help me? Thanks a lot. By the way
the work is from the Dell and Lenovo companies.
RESEARCH PART II FIN II From the data obtained in Research I. • Trend Analysis o Risk analysis . Business risk: • type of industry, • the variability of the firm's operating...
Good night, I have this second part of a research
paper for my Finance class but I do not understand what I should do
or know how to start. Could you help me? Thanks a lot. By the way
the work is from the Dell and Lenovo companies.
RESEARCH PART II FIN II From the data obtained in Research I. • Trend Analysis o Risk analysis . Business risk: • type of industry, • the variability of the firm's operating...
 I don't know what I have left
out, maybe my numbers are wrong but I have not a clue what I did
wrong. Can someone help me understand what is wrong and help?
The following are the transactions of Spotlighter, Inc., for the month of January. a. Borrowed $4,340 from a local bank on a note due in six months. b. Received $5,030 cash from investors and issued common stock to them. c. Purchased $1,400 in equipment, paying $400 cash...
I don't know what I have left
out, maybe my numbers are wrong but I have not a clue what I did
wrong. Can someone help me understand what is wrong and help?
The following are the transactions of Spotlighter, Inc., for the month of January. a. Borrowed $4,340 from a local bank on a note due in six months. b. Received $5,030 cash from investors and issued common stock to them. c. Purchased $1,400 in equipment, paying $400 cash...
 I am working on doing an analysis of a company for my accounting
class. can you please review what I have and correct what I have
wrong. Also, Help me with the ones I have left blank as I can not
find the right information to solve these. Thank you so much!!
Ratio:
Formula:
Year:
Formula:
Total:
Current Ratio:
Current Assets / Current Liabilities
2018
566,951 / 379,743
1.49
Acid-Test Ratio
Cash + Short- Term Investments + Current Receivables /...
I am working on doing an analysis of a company for my accounting
class. can you please review what I have and correct what I have
wrong. Also, Help me with the ones I have left blank as I can not
find the right information to solve these. Thank you so much!!
Ratio:
Formula:
Year:
Formula:
Total:
Current Ratio:
Current Assets / Current Liabilities
2018
566,951 / 379,743
1.49
Acid-Test Ratio
Cash + Short- Term Investments + Current Receivables /...
 Please give me a brief explanation, i do not understand
finance!!! Have a great day/night
How do i calculate:
1. DPS for 2010, question one.
2. Financial structure for question two.
option XYZ CORPORATION Balance Sheet as of December 31 2009 and 2010 (In thousands of Dollars) Assets 2009 2010 Current Assets: Cash and marketable securities Accounts receivable $2,760 7,230 $2,760 7,650 Total Fixed Assets: 21,240 22,260 Gross Plant and equipment Less: Depreciation Net Plant and equipment 33,750 4,500 40,800...
Please give me a brief explanation, i do not understand
finance!!! Have a great day/night
How do i calculate:
1. DPS for 2010, question one.
2. Financial structure for question two.
option XYZ CORPORATION Balance Sheet as of December 31 2009 and 2010 (In thousands of Dollars) Assets 2009 2010 Current Assets: Cash and marketable securities Accounts receivable $2,760 7,230 $2,760 7,650 Total Fixed Assets: 21,240 22,260 Gross Plant and equipment Less: Depreciation Net Plant and equipment 33,750 4,500 40,800...
 i need help on my retained earnings and income statement. i
have a income tax rate of 20% and my RE ending has to be 361,000.
not sure what i am missing on my income statement
here are some updated pictures
We were unable to transcribe this imageWe were unable to transcribe this imageWe were unable to transcribe this image17000 75000 25000 117000 50000 150000 400000 Liabilities and Shareholders' Equity Current Liabilities: Accounts Payable Income Tax Payable t Payable Current...
i need help on my retained earnings and income statement. i
have a income tax rate of 20% and my RE ending has to be 361,000.
not sure what i am missing on my income statement
here are some updated pictures
We were unable to transcribe this imageWe were unable to transcribe this imageWe were unable to transcribe this image17000 75000 25000 117000 50000 150000 400000 Liabilities and Shareholders' Equity Current Liabilities: Accounts Payable Income Tax Payable t Payable Current...
 Please include steps. (calculate for both 2010 &
2011)
I have attached all financial statements
Annual Data 1 Millions of US $ except per share data 2011-09-30 2010-09-30 2009 Revenue Cost Of Goods Sold Gross Profit $108,249 $64,431 $43,818 $2,429 $7,599 $65,225 $39,541 $25,684 $1,782 $5,517 $74,459 $33,790 $415 $34,205 $8,283 $25,922 EEEEE EE EE E E E E E E E E E E Research And Development Expenses SG&A Expenses Other Operating Income Or Expenses Operating Expenses Operating Income...
Please include steps. (calculate for both 2010 &
2011)
I have attached all financial statements
Annual Data 1 Millions of US $ except per share data 2011-09-30 2010-09-30 2009 Revenue Cost Of Goods Sold Gross Profit $108,249 $64,431 $43,818 $2,429 $7,599 $65,225 $39,541 $25,684 $1,782 $5,517 $74,459 $33,790 $415 $34,205 $8,283 $25,922 EEEEE EE EE E E E E E E E E E E Research And Development Expenses SG&A Expenses Other Operating Income Or Expenses Operating Expenses Operating Income...
 Hello, I have this exercise from my Investment class
but I need to know the procedure of how to reach the results. Could
you help me? Thank you.
Last year ABC company had the following data Net Sales million) # 1,200 Cost of G . Sold 780 Gross Profit Margin na 420 Depreciation 0. Expences 120 Adm. Expences 129 Operating Profit Interest Profit Before Tax Taxes Net Income Cash 200 3000 900 A keceivables inventory Net fixed assets Notes payable...
Hello, I have this exercise from my Investment class
but I need to know the procedure of how to reach the results. Could
you help me? Thank you.
Last year ABC company had the following data Net Sales million) # 1,200 Cost of G . Sold 780 Gross Profit Margin na 420 Depreciation 0. Expences 120 Adm. Expences 129 Operating Profit Interest Profit Before Tax Taxes Net Income Cash 200 3000 900 A keceivables inventory Net fixed assets Notes payable...
 Do i to m provide formulas
17-2 Financial Ratios The annual reports of Milano Italian clothing chain e d the low e steldea in millions, is the European cure FEES € 95" € 29 RS 62 350 165 20x2 20x1 2 0KO Annual amounts: Net income Gross margin on sales 250 Cost of goods sold Operating expenses 295 Income tax expose Dividends declared and paid End-of-year amounts Long-term assets Long-term debt Current liabilities Cash Accounts receivable 78 Merchandise 68 Paid-in...
Do i to m provide formulas
17-2 Financial Ratios The annual reports of Milano Italian clothing chain e d the low e steldea in millions, is the European cure FEES € 95" € 29 RS 62 350 165 20x2 20x1 2 0KO Annual amounts: Net income Gross margin on sales 250 Cost of goods sold Operating expenses 295 Income tax expose Dividends declared and paid End-of-year amounts Long-term assets Long-term debt Current liabilities Cash Accounts receivable 78 Merchandise 68 Paid-in...
 corporate Finance NU REYS (3) - Protected View - Last saved by user . Saved to this PC W Be careful--files from the Internet can contain viruses. Unless you need to edit, it's safer to stay in Protected View Enable Editing Question 14_Calculate the capital expenditure, Free Cash Flow to Equity (FCFE) and FCFE per share for year 2000 (5 points) • What are year 2000's capital expenditures? Show your calcualtion (2 points) • Free Cash Flow to Equity for...
Most questions answered within 3 hours.
-
Where is the error in this code sequence?
String s1 = "Hello";
String s2 = "ello";...
asked 10 months ago -
Financial data for Joel de Paris, Inc., for last year
follow:
Joel de Paris, Inc.
Balance...
asked 10 months ago -
Consider this reaction:
Al2(SO4)3 (aq)+ BaCl3
(aq) Al2Cl6 (aq)- +
3BaSO4(s) . What is the...
asked 10 months ago -
Suppose that Savneet is considering increasing her
recent random sample from 20 car rentals to 40...
asked 10 months ago -
Trucks arrive at an unloading terminal at an average rate of 120
per hour.
Trucks arrive...
asked 10 months ago -
Why are methanol and ethanol completely soluble in water while
octanol is not very little soluble....
asked 10 months ago -
A facilities manager at a university reads in a research report
that the mean amount of...
asked 10 months ago -
When the CuSO4 is rehydrated by adding water to the anhydrous
compound, is this an endothermic...
asked 10 months ago -
A ray of sunlight is passing from diamond into crown glass; the
angle of incidence is...
asked 10 months ago -
A block of mass 0.249 kg is placed on top of a light, vertical
spring of...
asked 10 months ago -
how do the kidneys compensate in the presences of acidosis
a) trigger hyperventilate
b) reserve acid...
asked 10 months ago -
Question 501 pts
The rental rate of capital to the firm increases. Which of the
following...
asked 10 months ago