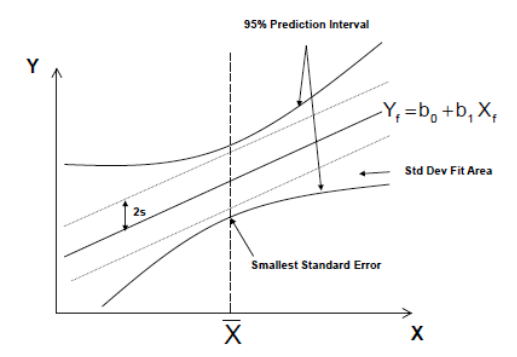
How do I get the plot below in R?
Homework Answers
Below is the R code to create this plot:
install.packages("ggplot2")
library(ggplot2)
ggplot(df, aes(x = X, y = Y)) + geom_smooth(method = "lm", se = TRUE) + geom_line(aes(y = Y + 2s), linetype = "dotted") + geom_line(aes(y = Y - 2s), linetype = "dotted")
** If the answer does not match please comment.
Add Answer to:
How do I get the plot below in R?
95% Prediction Interval Std Dev Fit Area...
Female: Mean: 592 Std. dev.: 94 Male: Mean:628 Std. dev.:89 Calculate the interval corresponding to one,...
Female: Mean: 592 Std. dev.: 94 Male: Mean:628 Std. dev.:89 Calculate the interval corresponding to one, two, and three standard deviations. Type your work showing how you obtained these intervals. Keep the endpoints of the final intervals as whole numbers and clearly label and list these three intervals in your document as shown below: 68% interval (lower value, upper value) 95% interval (lower value, upper value) 99.7% interval (lower value, upper value)
The accompanying scatto plot shows the regression line, 95% confidence interval, and 95% prediction interval for...
 The accompanying scatto plot shows the regression line, 95% confidence interval, and 95% prediction interval for youth unemployment data for a sa The response variable is the Female Rate and the predictor variable is the Male Rate. a) Explain the meaning of the 95% prediction interval in this context. b) Explain the meaning of the 95% confidence interval in this context. c) Using a statistics program, identify any unusual observations, and discuss their potential impact on the regression. Click the...
Calculate the 95% prediction interval of y when x=5 using the 2000 pairs Mean of x...
Calculate the 95% prediction interval of y when x=5 using the 2000 pairs Mean of x = 4.51 Regression Statistics Multiple R 0.012848 R Square 0.000165 Adjusted R Square -0.00034 Standard Error 2.869737 Observations 2000 ANOVA df SS MS F Significance F Regression 1 2.716416 2.716416 0.329847 0.565814 Residual 1998 16454.31 8.235388 Total 1999 16457.02 Coefficients Standard Error t Stat P-value Lower 95% Upper 95% Lower 95.0% Upper 95.0% Intercept 4.509054 0.119572 37.70997 1.7E-235 4.274555 4.743552574 4.274555 4.743553 X 0.012884...
Please help me to solve part c of the question (prediction interval) by using any software "or" R...
 Please help me to solve part c of the question
(prediction interval) by using any software "or" R "or" Minitab
(whatever technology you want to use you can use to solve this
part).
ent store are shown (in hundreds of thousands of dollars) in the table below for a Retail sales in quarters 1-4 over a 10-year 25.8 27.7 27.3 31.3 22.8 24.6 24.8 28.1 20.5 23.6 20.8 28.3 19.1 19.5 19.4 25 Year Quarter 1 Quarter 2 Quarter3 Quarter...
Please help me to solve part c of the question
(prediction interval) by using any software "or" R "or" Minitab
(whatever technology you want to use you can use to solve this
part).
ent store are shown (in hundreds of thousands of dollars) in the table below for a Retail sales in quarters 1-4 over a 10-year 25.8 27.7 27.3 31.3 22.8 24.6 24.8 28.1 20.5 23.6 20.8 28.3 19.1 19.5 19.4 25 Year Quarter 1 Quarter 2 Quarter3 Quarter...
I) Discuss how the integral (area under the plot) differs from the true area (A) as a function of...
 i) Discuss how the integral (area under the plot) differs from the true area (A) as a function of n, by plotting the residuals (i.e.y-y) in the ranget-0.0 to 0.3 for n-1,2,5,20 i)If y(t) is the shape of the function and y,(t) is the estimator given by summing the Fourier series to order n make a plot to show (H, will have to be computed numerically). Why is H, more useful than the integral under the plots (residuals determined in...
#2 Options The Prediction Interval would: -be identical to the confidence interval- -have the sam...
 #2 Options
The Prediction Interval would:
-be identical to the confidence interval-
-have the same center as, but would be narrower than the
confidence interval-
-be to the left of the confidence interval-
-be to the right of the confidence interval-
-have the same center as, but would be wider than the confidence
interval-
#3 Options
The interval computed from a mileage of 31.0 would:
-be narrower but have the same center-
-be wider but have the same center-
-be...
#2 Options
The Prediction Interval would:
-be identical to the confidence interval-
-have the same center as, but would be narrower than the
confidence interval-
-be to the left of the confidence interval-
-be to the right of the confidence interval-
-have the same center as, but would be wider than the confidence
interval-
#3 Options
The interval computed from a mileage of 31.0 would:
-be narrower but have the same center-
-be wider but have the same center-
-be...
For this question, i have trouble doing the first one. Can you please explain how can i get the RATE OF RETURN FOR RF?...
 For this question, i have trouble doing the first one. Can you
please explain how can i get the RATE OF RETURN FOR RF?
Thanks
X Yand Zare portfolios of securities. Data pertaining to these portfolios and the market portfolio are given in the following table: Std dev(R 0.28 Cov(Ri Rm Portfolio E(RD Beta P p.m X 0.015 Y 0.23 ? 0.17 1.5 0.92 0.048 0.34 ? M ? 0.10 2 0.02 Also Cov(Rs.Ry= 0.04 REQUIRED risk free Calculate the...
For this question, i have trouble doing the first one. Can you
please explain how can i get the RATE OF RETURN FOR RF?
Thanks
X Yand Zare portfolios of securities. Data pertaining to these portfolios and the market portfolio are given in the following table: Std dev(R 0.28 Cov(Ri Rm Portfolio E(RD Beta P p.m X 0.015 Y 0.23 ? 0.17 1.5 0.92 0.048 0.34 ? M ? 0.10 2 0.02 Also Cov(Rs.Ry= 0.04 REQUIRED risk free Calculate the...
How does R calculate “Std. Error”? How can I do it by hand? Max Call: glm(formula...
 How does R calculate “Std. Error”? How can I do it by
hand?
Max Call: glm(formula = cbind(damage, 6 - damage) - temp, family - binomial(link = "probit"), data = orings) Deviance Residuals: Min 10 Median 3Q -1.0134 -0.7761 -0.4467 -0.1581 1.9983 Coefficients: Estimate Std. Error z value Prizl), (Intercept) 5.59145 1.71055 3.269 0.00108 ** temp -0.10580 0.02656 -3.984 6.79e-05 *** signif. codes: 0 ***** 0.001 **** 0.01 *' 0.05 0.1 * 1 (Dispersion parameter for binomial family taken to...
How does R calculate “Std. Error”? How can I do it by
hand?
Max Call: glm(formula = cbind(damage, 6 - damage) - temp, family - binomial(link = "probit"), data = orings) Deviance Residuals: Min 10 Median 3Q -1.0134 -0.7761 -0.4467 -0.1581 1.9983 Coefficients: Estimate Std. Error z value Prizl), (Intercept) 5.59145 1.71055 3.269 0.00108 ** temp -0.10580 0.02656 -3.984 6.79e-05 *** signif. codes: 0 ***** 0.001 **** 0.01 *' 0.05 0.1 * 1 (Dispersion parameter for binomial family taken to...
How do I interpret the p-values in terms of rejecting or failing to reject H0 at...
 How do I interpret the p-values in terms of rejecting or failing
to reject H0 at a 95% confidence level? What does the intercept
column mean in terms of p-value? How does the p-value of the F test
compare and what does it mean? In the simple linear regression I'd
conclude age isn't related to pulmonary disease (what does
intercept p-value mean) but for the multiple regression I'd say age
and height aren't related to pulmonary disease but smoking is...
How do I interpret the p-values in terms of rejecting or failing
to reject H0 at a 95% confidence level? What does the intercept
column mean in terms of p-value? How does the p-value of the F test
compare and what does it mean? In the simple linear regression I'd
conclude age isn't related to pulmonary disease (what does
intercept p-value mean) but for the multiple regression I'd say age
and height aren't related to pulmonary disease but smoking is...
Please Help I need the answers to below. Question 2: Construct a 95% confidence interval for...
Please Help I need the answers to below. Question 2: Construct a 95% confidence interval for the population mean. Assume that your data is normally distributed and σ is unknown. Include a statement that correctly interprets the confidence interval in context of the scenario. Calculations/Values Formulas/Answers Mean 72,224.34 Standard Deviation 22,644.46 n 364 Critical Value Margin of Error Lower Limit Upper Limit Question 3 construct a 99% confidence interval for the population mean. Assume that your data is normally distributed...
 The accompanying scatto plot shows the regression line, 95% confidence interval, and 95% prediction interval for youth unemployment data for a sa The response variable is the Female Rate and the predictor variable is the Male Rate. a) Explain the meaning of the 95% prediction interval in this context. b) Explain the meaning of the 95% confidence interval in this context. c) Using a statistics program, identify any unusual observations, and discuss their potential impact on the regression. Click the...
 Please help me to solve part c of the question
(prediction interval) by using any software "or" R "or" Minitab
(whatever technology you want to use you can use to solve this
part).
ent store are shown (in hundreds of thousands of dollars) in the table below for a Retail sales in quarters 1-4 over a 10-year 25.8 27.7 27.3 31.3 22.8 24.6 24.8 28.1 20.5 23.6 20.8 28.3 19.1 19.5 19.4 25 Year Quarter 1 Quarter 2 Quarter3 Quarter...
Please help me to solve part c of the question
(prediction interval) by using any software "or" R "or" Minitab
(whatever technology you want to use you can use to solve this
part).
ent store are shown (in hundreds of thousands of dollars) in the table below for a Retail sales in quarters 1-4 over a 10-year 25.8 27.7 27.3 31.3 22.8 24.6 24.8 28.1 20.5 23.6 20.8 28.3 19.1 19.5 19.4 25 Year Quarter 1 Quarter 2 Quarter3 Quarter...
 i) Discuss how the integral (area under the plot) differs from the true area (A) as a function of n, by plotting the residuals (i.e.y-y) in the ranget-0.0 to 0.3 for n-1,2,5,20 i)If y(t) is the shape of the function and y,(t) is the estimator given by summing the Fourier series to order n make a plot to show (H, will have to be computed numerically). Why is H, more useful than the integral under the plots (residuals determined in...
 #2 Options
The Prediction Interval would:
-be identical to the confidence interval-
-have the same center as, but would be narrower than the
confidence interval-
-be to the left of the confidence interval-
-be to the right of the confidence interval-
-have the same center as, but would be wider than the confidence
interval-
#3 Options
The interval computed from a mileage of 31.0 would:
-be narrower but have the same center-
-be wider but have the same center-
-be...
#2 Options
The Prediction Interval would:
-be identical to the confidence interval-
-have the same center as, but would be narrower than the
confidence interval-
-be to the left of the confidence interval-
-be to the right of the confidence interval-
-have the same center as, but would be wider than the confidence
interval-
#3 Options
The interval computed from a mileage of 31.0 would:
-be narrower but have the same center-
-be wider but have the same center-
-be...
 For this question, i have trouble doing the first one. Can you
please explain how can i get the RATE OF RETURN FOR RF?
Thanks
X Yand Zare portfolios of securities. Data pertaining to these portfolios and the market portfolio are given in the following table: Std dev(R 0.28 Cov(Ri Rm Portfolio E(RD Beta P p.m X 0.015 Y 0.23 ? 0.17 1.5 0.92 0.048 0.34 ? M ? 0.10 2 0.02 Also Cov(Rs.Ry= 0.04 REQUIRED risk free Calculate the...
For this question, i have trouble doing the first one. Can you
please explain how can i get the RATE OF RETURN FOR RF?
Thanks
X Yand Zare portfolios of securities. Data pertaining to these portfolios and the market portfolio are given in the following table: Std dev(R 0.28 Cov(Ri Rm Portfolio E(RD Beta P p.m X 0.015 Y 0.23 ? 0.17 1.5 0.92 0.048 0.34 ? M ? 0.10 2 0.02 Also Cov(Rs.Ry= 0.04 REQUIRED risk free Calculate the...
 How does R calculate “Std. Error”? How can I do it by
hand?
Max Call: glm(formula = cbind(damage, 6 - damage) - temp, family - binomial(link = "probit"), data = orings) Deviance Residuals: Min 10 Median 3Q -1.0134 -0.7761 -0.4467 -0.1581 1.9983 Coefficients: Estimate Std. Error z value Prizl), (Intercept) 5.59145 1.71055 3.269 0.00108 ** temp -0.10580 0.02656 -3.984 6.79e-05 *** signif. codes: 0 ***** 0.001 **** 0.01 *' 0.05 0.1 * 1 (Dispersion parameter for binomial family taken to...
How does R calculate “Std. Error”? How can I do it by
hand?
Max Call: glm(formula = cbind(damage, 6 - damage) - temp, family - binomial(link = "probit"), data = orings) Deviance Residuals: Min 10 Median 3Q -1.0134 -0.7761 -0.4467 -0.1581 1.9983 Coefficients: Estimate Std. Error z value Prizl), (Intercept) 5.59145 1.71055 3.269 0.00108 ** temp -0.10580 0.02656 -3.984 6.79e-05 *** signif. codes: 0 ***** 0.001 **** 0.01 *' 0.05 0.1 * 1 (Dispersion parameter for binomial family taken to...
 How do I interpret the p-values in terms of rejecting or failing
to reject H0 at a 95% confidence level? What does the intercept
column mean in terms of p-value? How does the p-value of the F test
compare and what does it mean? In the simple linear regression I'd
conclude age isn't related to pulmonary disease (what does
intercept p-value mean) but for the multiple regression I'd say age
and height aren't related to pulmonary disease but smoking is...
How do I interpret the p-values in terms of rejecting or failing
to reject H0 at a 95% confidence level? What does the intercept
column mean in terms of p-value? How does the p-value of the F test
compare and what does it mean? In the simple linear regression I'd
conclude age isn't related to pulmonary disease (what does
intercept p-value mean) but for the multiple regression I'd say age
and height aren't related to pulmonary disease but smoking is...
Most questions answered within 3 hours.
-
Where is the error in this code sequence?
String s1 = "Hello";
String s2 = "ello";...
asked 10 months ago -
Financial data for Joel de Paris, Inc., for last year
follow:
Joel de Paris, Inc.
Balance...
asked 10 months ago -
Consider this reaction:
Al2(SO4)3 (aq)+ BaCl3
(aq) Al2Cl6 (aq)- +
3BaSO4(s) . What is the...
asked 10 months ago -
Suppose that Savneet is considering increasing her
recent random sample from 20 car rentals to 40...
asked 10 months ago -
Trucks arrive at an unloading terminal at an average rate of 120
per hour.
Trucks arrive...
asked 10 months ago -
Why are methanol and ethanol completely soluble in water while
octanol is not very little soluble....
asked 10 months ago -
A facilities manager at a university reads in a research report
that the mean amount of...
asked 10 months ago -
When the CuSO4 is rehydrated by adding water to the anhydrous
compound, is this an endothermic...
asked 10 months ago -
A ray of sunlight is passing from diamond into crown glass; the
angle of incidence is...
asked 10 months ago -
A block of mass 0.249 kg is placed on top of a light, vertical
spring of...
asked 10 months ago -
how do the kidneys compensate in the presences of acidosis
a) trigger hyperventilate
b) reserve acid...
asked 10 months ago -
Question 501 pts
The rental rate of capital to the firm increases. Which of the
following...
asked 10 months ago