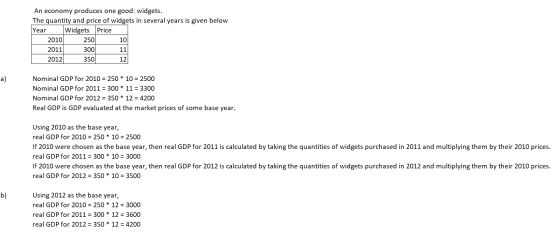
3. An economy produces one good: widgets. The quantity and price of widgets in several years...
Homework Answers
Add Answer to:
3. An economy produces one good: widgets. The quantity and
price of widgets in several years...
please work on that carefully. thank you 1. Say whether each of the following is or...
please work on that carefully. thank you 1. Say whether each of the following is or is not counted (directly) as part of GDP. a. David mows his lawn. b. David starts a landscaping company and mows his neighbor’s lawn for money. c. David buys a new lawnmower for his landscaping business. d. David buys a used truck for his business. 2. Say which category of GDP each of the following falls into. a. A sewing machine b. A cheeseburger...
Styles 1. Say whether each of the following is or is not counted (directly) as part...
 Styles 1. Say whether each of the following is or is not counted (directly) as part of GDP. a. David mows his lawn. b. David starts a landscaping company and mows his neighbor's lawn for money. c. David buys a new lawnmower for his landscaping business. d. David buys a used truck for his business. 2. Say which category of GDP each of the following falls into. a. A sewing machine b. A cheeseburger C. A fighter jet 3. An...
Assume that an economy produces only three goods; Computers, cars, and pizza. Table 1 gives the price and quantity for each good and the number of employed and unemployed individuals for the years 2010-2013. Table 2 gives the fixed basket used for calcula
 Assume that an economy produces
only three goods; Computers, cars, and pizza. Table 1 gives the price
and quantity for each good and the number of employed and unemployed
individuals for the years 2010-2013. Table 2 gives the fixed basket used
for calculating the CPI. Assume that the base year is 2011 and show
your work! Table 1 - Price and Quantity of Goods Sold in 2010-2013 2010
2011 2012 2013 P Q P O P Q 25 Computers Cars...
Assume that an economy produces
only three goods; Computers, cars, and pizza. Table 1 gives the price
and quantity for each good and the number of employed and unemployed
individuals for the years 2010-2013. Table 2 gives the fixed basket used
for calculating the CPI. Assume that the base year is 2011 and show
your work! Table 1 - Price and Quantity of Goods Sold in 2010-2013 2010
2011 2012 2013 P Q P O P Q 25 Computers Cars...
5. The economy of Britannica produces three Year Computers DVDs Pizzas goods: computers, DVDs, and pizza....
 5. The economy of Britannica produces three Year Computers DVDs Pizzas goods: computers, DVDs, and pizza. The Price Quantity Price Quantity Price Quantity accompanying table shows the prices and 2010 $900 10 $10 100 15 2 output of the three goods for the years 2011 1,000 10.5 12 105 16 2 2012 1,050 12 14 110 2010, 2011, and 2012. a. Calculate nominal GDP in Britannica for each of the three years. What is the per- cent change in nominal...
2010 Prices 2010 Quantity 2011 Prices 2011 Quantity 2012 Prices 2012 Quantity Apples $3 5 $3...
2010 Prices 2010 Quantity 2011 Prices 2011 Quantity 2012 Prices 2012 Quantity Apples $3 5 $3 11 $3 8 Oranges $2 9 $9 3 $1 10 Nominal GDP Real GDP A. Calculate the nominal and the real GDP in each year for the economy. 2010 is your base year. B. If the real GDP was $150 in 2013 and $182 in 2014, what would the GDP growth rate would be? What would this mean? C. If the nominal GDP was $250 in 2014...
HW 3 Due Monday, September 30, 2019 The economy below produces spoons and forks. Complete the...
HW 3 Due Monday, September 30, 2019 The economy below produces spoons and forks. Complete the following table. Year Price of Spoons Quantity of Spoons Price of Forks Quantity of Forks Nominal GDP Real GDP 2015 $250 250 $15 500 2016 $350 350 $15 600 2017 $350 350 $20 600 1. Refer to the table above. In 2017, the percentage change in real GDP is _____________ 2. Complete the following table. Year NGDP RGDP Deflator 2011 $120 100 2012 $240...
Suppose an economy produces only two goods, cups of coffee and gallons of milk as shown...
 Suppose an economy produces only two goods, cups of coffee and gallons of milk as shown in Table below: TABLE Nominal versus real GDP YEAR COFFEE (CUPS) MILK (GALLONS) GDP (NOMINAL, REAL) 2010 (The Price $1.00 Quantity 10 Price $2.00 Quantity 20 base year) Expenditure Price $1.50 Quantity 10 Price $4.00 Quantity 20 2011 (Case 1) Expenditure Price $1.00 Quantity 15 Price $2.00 Quantity 40 2011 (Case 2) Expenditure Price $1.50 Quantity 15 Price $4.00 Quantity 40 2011 (Case 3)...
A and B Question 1.2 points. The following table reports data for a fictional economy that...
 A
and B
Question 1.2 points. The following table reports data for a fictional economy that produces only 3 goods. For example, according to the table, in 2009, this economy produced 10 units of Good A, 15 units of Good B, and 5 units of Good C. The price of Good A in 2009 and 2010 was s0.30, in 2011 it increased to S0.35, and it increased again in 2012 to $0.37. Good A Good B Good C Price Quantity...
A
and B
Question 1.2 points. The following table reports data for a fictional economy that produces only 3 goods. For example, according to the table, in 2009, this economy produced 10 units of Good A, 15 units of Good B, and 5 units of Good C. The price of Good A in 2009 and 2010 was s0.30, in 2011 it increased to S0.35, and it increased again in 2012 to $0.37. Good A Good B Good C Price Quantity...
An economy produces only robots, pens, and pizza
 An economy produces only robots, pens, and pizza The table gives the quantities produced and prices in 2016 and 2017 The base your is 2016 What is nominal GDP in 2016 and in 2017? Nominal GDP in 2016 is $_______ Nominal GDP in 2017 is $_______ A south sea island produces only coconuts In 2010, the price of a coconut is $2.00 and the quantity produced is 350 In 2017, the price of a coconut is $1.50 and the quantity produced is 300 2010 is the base year Real GDP...
Question 11 44 pts Assume that an economy produces only three goods; Computers, cars, and pizza. Table 1 gives the price and quantity for each good and the number of employed and unemployed individuals for the years 2017-2020. Table 2 gives the fixed bask
 Question 11 44 pts Assume that an
economy produces only three goods; Computers, cars, and pizza. Table 1
gives the price and quantity for each good and the number of employed
and unemployed individuals for the years 2017-2020. Table 2 gives the
fixed basket used for calculating the CPI. Assume that the base year is
2018! Table 1 - Price and Quantity of Goods Sold in 2017-2020 2017 2018
2019 2020 Р Q 20 Q 15 Computers Р $400/unit $18,000/unit...
Question 11 44 pts Assume that an
economy produces only three goods; Computers, cars, and pizza. Table 1
gives the price and quantity for each good and the number of employed
and unemployed individuals for the years 2017-2020. Table 2 gives the
fixed basket used for calculating the CPI. Assume that the base year is
2018! Table 1 - Price and Quantity of Goods Sold in 2017-2020 2017 2018
2019 2020 Р Q 20 Q 15 Computers Р $400/unit $18,000/unit...
 Styles 1. Say whether each of the following is or is not counted (directly) as part of GDP. a. David mows his lawn. b. David starts a landscaping company and mows his neighbor's lawn for money. c. David buys a new lawnmower for his landscaping business. d. David buys a used truck for his business. 2. Say which category of GDP each of the following falls into. a. A sewing machine b. A cheeseburger C. A fighter jet 3. An...
 5. The economy of Britannica produces three Year Computers DVDs Pizzas goods: computers, DVDs, and pizza. The Price Quantity Price Quantity Price Quantity accompanying table shows the prices and 2010 $900 10 $10 100 15 2 output of the three goods for the years 2011 1,000 10.5 12 105 16 2 2012 1,050 12 14 110 2010, 2011, and 2012. a. Calculate nominal GDP in Britannica for each of the three years. What is the per- cent change in nominal...
 Suppose an economy produces only two goods, cups of coffee and gallons of milk as shown in Table below: TABLE Nominal versus real GDP YEAR COFFEE (CUPS) MILK (GALLONS) GDP (NOMINAL, REAL) 2010 (The Price $1.00 Quantity 10 Price $2.00 Quantity 20 base year) Expenditure Price $1.50 Quantity 10 Price $4.00 Quantity 20 2011 (Case 1) Expenditure Price $1.00 Quantity 15 Price $2.00 Quantity 40 2011 (Case 2) Expenditure Price $1.50 Quantity 15 Price $4.00 Quantity 40 2011 (Case 3)...
 A
and B
Question 1.2 points. The following table reports data for a fictional economy that produces only 3 goods. For example, according to the table, in 2009, this economy produced 10 units of Good A, 15 units of Good B, and 5 units of Good C. The price of Good A in 2009 and 2010 was s0.30, in 2011 it increased to S0.35, and it increased again in 2012 to $0.37. Good A Good B Good C Price Quantity...
A
and B
Question 1.2 points. The following table reports data for a fictional economy that produces only 3 goods. For example, according to the table, in 2009, this economy produced 10 units of Good A, 15 units of Good B, and 5 units of Good C. The price of Good A in 2009 and 2010 was s0.30, in 2011 it increased to S0.35, and it increased again in 2012 to $0.37. Good A Good B Good C Price Quantity...
Most questions answered within 3 hours.
-
Where is the error in this code sequence?
String s1 = "Hello";
String s2 = "ello";...
asked 11 months ago -
Financial data for Joel de Paris, Inc., for last year
follow:
Joel de Paris, Inc.
Balance...
asked 11 months ago -
Consider this reaction:
Al2(SO4)3 (aq)+ BaCl3
(aq) Al2Cl6 (aq)- +
3BaSO4(s) . What is the...
asked 11 months ago -
Suppose that Savneet is considering increasing her
recent random sample from 20 car rentals to 40...
asked 11 months ago -
Trucks arrive at an unloading terminal at an average rate of 120
per hour.
Trucks arrive...
asked 11 months ago -
Why are methanol and ethanol completely soluble in water while
octanol is not very little soluble....
asked 11 months ago -
A facilities manager at a university reads in a research report
that the mean amount of...
asked 11 months ago -
When the CuSO4 is rehydrated by adding water to the anhydrous
compound, is this an endothermic...
asked 11 months ago -
A ray of sunlight is passing from diamond into crown glass; the
angle of incidence is...
asked 11 months ago -
A block of mass 0.249 kg is placed on top of a light, vertical
spring of...
asked 11 months ago -
how do the kidneys compensate in the presences of acidosis
a) trigger hyperventilate
b) reserve acid...
asked 11 months ago -
Question 501 pts
The rental rate of capital to the firm increases. Which of the
following...
asked 11 months ago