
Homework Answers
I have used Minitab software
Steps
- Enter the data

- Stat-table-Chi square test for association
-

- ok


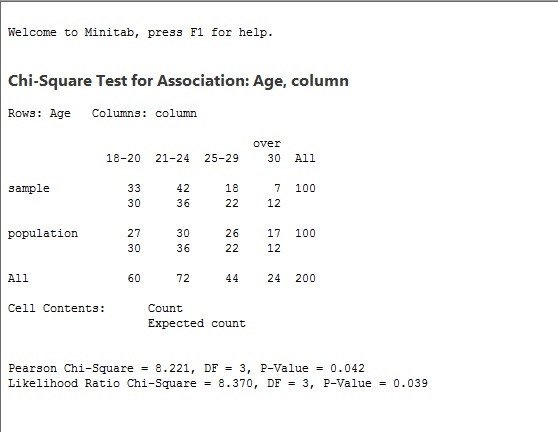
output
.
------------------------------------------------------------------------------------------------------------------------------------------------------------------------------------------------------------------------------------------------------------
a)
The null hypothesis H0:Age distribution is same
The alternative hypothesis:H1:The age distribution is different
--------------------
b)Chi square=8.2
--------------------
c) As p-value is less than 0.05 we reject the null hypothesis and conclude that the age distribution of sample is different from age distribution of popuplation.
---------------------
PLEASE UPVOTE IF YOU LIKE MY ANSWER
THANK YOU
Add Answer to:
The Office of Institutional Research at UP would like to examine the age distribution of the...
A company would like to examine the linear relationship between the age and credit score of...
 A company would like to examine the linear relationship between the age and credit score of an individual. The following table shows the credit scores and ages of 5 randomly selected people. These data have a sample correlation coefficient, rounded to three decimal places, of 0.970. Using this data and a = 0.05, test if the population correlation coefficient between a person's age and credit score is different than zero. What conclusions can you draw? Age 39 27 55 26...
The age distribution of the Canadian population and the age distribution of a random sample of...
The age distribution of the Canadian population and the age distribution of a random sample of 455 residents in the Indian community of a village are shown below. Age (years) Percent of Canadian Population Observed Number in the Village Under 5 7.2% 43 5 to 14 13.6% 73 15 to 64 67.1% 297 65 and older 12.1% 42 Use a 5% level of significance to test the claim that the age distribution of the general Canadian population fits the age...
The age distribution of the Canadian population and the age distribution of a random sample of...
The age distribution of the Canadian population and the age distribution of a random sample of 455 residents in the Indian community of a village are shown below. Age (years) Percent of Canadian Population Observed Number in the Village Under 5 7.2% 44 5 to 14 13.6% 74 15 to 64 67.1% 296 65 and older 12.1% 41 Use a 5% level of significance to test the claim that the age distribution of the general Canadian population fits the age...
The age distribution of the Canadian population and the age distribution of a random sample of...
The age distribution of the Canadian population and the age distribution of a random sample of 455 residents in the Indian community of a village are shown below. Age (years) Percent of Canadian Population Observed Number in the Village Under 5 7.2% 52 5 to 14 13.6% 75 15 to 64 67.1% 282 65 and older 12.1% 46 Use a 5% level of significance to test the claim that the age distribution of the general Canadian population fits the age...
The age distribution of the Canadian population and the age distribution of a random sample of...
 The age distribution of the Canadian population and the age distribution of a random sample of 455 residents in the Indian community of a village are shown below. Use a 5% level of significance to test the claim that the age distribution of the general Canadian population fits the age distribution of the residents of Red Lake Village. (a) What is the level of significance? State the null and alternate hypotheses O Ho: The distributions are different. H1: The distributions...
The age distribution of the Canadian population and the age distribution of a random sample of 455 residents in the Indian community of a village are shown below. Age (years) Percent of Canadian Po...
The age distribution of the Canadian population and the age distribution of a random sample of 455 residents in the Indian community of a village are shown below. Age (years) Percent of Canadian Population Observed Number in the Village Under 5 7.2% 48 5 to 14 13.6% 79 15 to 64 67.1% 281 65 and older 12.1% 47 Use a 5% level of significance to test the claim that the age distribution of the general Canadian population fits the age...
The following table shows age distribution and location of a random sample of 166 buffalo in...
The following table shows age distribution and location of a random sample of 166 buffalo in a national park. Age Lamar District Nez Perce District Firehole District Row Total Calf 12 14 15 41 Yearling 11 11 11 33 Adult 33 31 28 92 Column Total 56 56 54 166 Use a chi-square test to determine if age distribution and location are independent at the 0.05 level of significance. (a) What is the level of significance? 0.05 State the null...
The following table shows age distribution and location of a random sample of 166 buffalo in...
The following table shows age distribution and location of a random sample of 166 buffalo in a national park. Age Lamar District Nez Perce District Firehole District Row Total Calf 13 13 15 41 Yearling 13 11 9 33 Adult 35 28 29 92 Column Total 61 52 53 166 Use a chi-square test to determine if age distribution and location are independent at the 0.05 level of significance. (a) What is the level of significance? State the null and...
It is believed that the average age students is 26. Using a 0.05 level of significance,...
It is believed that the average age students is 26. Using a 0.05 level of significance, should the findings of the Class Survey support the belief that the average age is 26. The population standard deviation is 6.5. data set:(age) 31 30 21 20 44 43 23 25 30 28 19 21 21 37 26 20 19 22 28 40 20 48 19 20 36 20 20 19 19 21 47 19 21 19 17 19 20 20 32 23...
 A company would like to examine the linear relationship between the age and credit score of an individual. The following table shows the credit scores and ages of 5 randomly selected people. These data have a sample correlation coefficient, rounded to three decimal places, of 0.970. Using this data and a = 0.05, test if the population correlation coefficient between a person's age and credit score is different than zero. What conclusions can you draw? Age 39 27 55 26...
 The age distribution of the Canadian population and the age distribution of a random sample of 455 residents in the Indian community of a village are shown below. Use a 5% level of significance to test the claim that the age distribution of the general Canadian population fits the age distribution of the residents of Red Lake Village. (a) What is the level of significance? State the null and alternate hypotheses O Ho: The distributions are different. H1: The distributions...
Most questions answered within 3 hours.
-
Where is the error in this code sequence?
String s1 = "Hello";
String s2 = "ello";...
asked 11 months ago -
Financial data for Joel de Paris, Inc., for last year
follow:
Joel de Paris, Inc.
Balance...
asked 11 months ago -
Consider this reaction:
Al2(SO4)3 (aq)+ BaCl3
(aq) Al2Cl6 (aq)- +
3BaSO4(s) . What is the...
asked 11 months ago -
Suppose that Savneet is considering increasing her
recent random sample from 20 car rentals to 40...
asked 11 months ago -
Trucks arrive at an unloading terminal at an average rate of 120
per hour.
Trucks arrive...
asked 11 months ago -
Why are methanol and ethanol completely soluble in water while
octanol is not very little soluble....
asked 11 months ago -
A facilities manager at a university reads in a research report
that the mean amount of...
asked 11 months ago -
When the CuSO4 is rehydrated by adding water to the anhydrous
compound, is this an endothermic...
asked 11 months ago -
A ray of sunlight is passing from diamond into crown glass; the
angle of incidence is...
asked 11 months ago -
A block of mass 0.249 kg is placed on top of a light, vertical
spring of...
asked 11 months ago -
how do the kidneys compensate in the presences of acidosis
a) trigger hyperventilate
b) reserve acid...
asked 11 months ago -
Question 501 pts
The rental rate of capital to the firm increases. Which of the
following...
asked 11 months ago