
Homework Answers
a)

b)

c) 
d)
 e)
e)
 f)
f)

Add Answer to:
2. The following data were obtained in a su wine data were obtained in a study...
Using the information obtained from the previous study about exercise, the following data was obtained for...
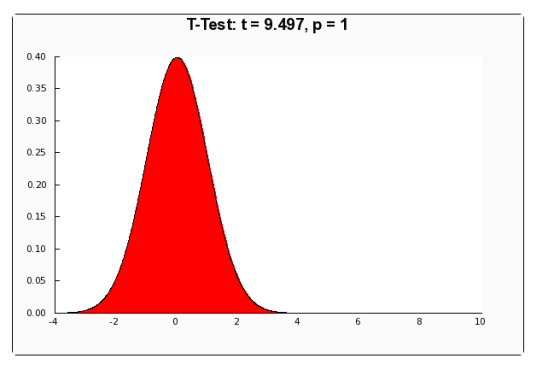
 Using the information obtained from the previous study about exercise, the following data was obtained for the hypothesis test: • Hou = 9.7. H.: # 9.7 • Assume the significance level is a = 0.10. • The z- test statistic is calculated as 3.03. What is the p-value and conclusion for this hypothesis test? Move the blue dot to choose the appropriate test(left, right, or two-tailed). Use the graph below to move the slider to the test statistic in order...
The following sample data were obtained from three populations where the variances were not equal, and...
 The following sample data were obtained from three populations where the variances were not equal, and you wish to compare the populations. Sample 1 20 26 38 45 60 70 Sample 2 13 15 23 28 31 Sample 3 39 43 46 51 55 Click here for the Excel Data File a. State the null hypothesis. HO: H1: b. Using the 0.02 level of risk, state the decision rule. (Round your answer to 3 decimal places.) Reject HO if H>...
The value obtained for the test statistic, z, in a one-mean 2-test is given. Whether the...
 The value obtained for the test statistic, z, in a one-mean 2-test is given. Whether the test is two tailed, left tailed, or right tailed is also specified. For parts (a) and (b). determine the P-value and decide whether, at the 1% significance level, the data provide sufficient evidence to reject the null hypothesis in favor of the alternative hypothesis. a. The test statistic in a two-tailed test is z= -1.42. The P-value is (Round to three cocimal places as...
In studying the responses to a multiple-choice test question, the following sample data were obtained. At...
 In studying the responses to a multiple-choice test question, the following sample data were obtained. At the 0.10 significance level, test the claim that the responses occur with the same frequency. Ho: The responses to the questions occur with the same frequency Ha: The responses to the questions do not occur with the same frequency C 2 Observed Expected | (O - E) Response Frequency |Frequency E 24 A B 6 C 6 25 D E 17 What is the...
an independent measures research study uses 2 samples, each with n=12 participants. if the data produce...
an independent measures research study uses 2 samples, each with n=12 participants. if the data produce a t statistic of t=2.50, then which of the following is the correct decision for a 2 tailed hypothesis test? a. reject the null hypothesis with a=.05 but fail to reject with a=.01 b. reject the null hypothesis with either a=.05 or a=.01 c. fail to reject the null hypothesis with either a = .05 or a=.01 d. cannot answer without additional information
Use the following to answer questions 1-4. The average house hold size in a certain region...
Use the following to answer questions 1-4. The average house hold size in a certain region several years ago was 3.14. A sociologist wishes to test, at 5% level of significance, whether it is different now. Perform the test using the information collected by the sociologist; in a random sample of 75 households, the average size was 2.98 persons, with sample standard deviation 0.82 persons. 1. Set up the null and alternative hypothesis to test the researcher’s claim. a. ?0:?=2.98...
Question One A market research company examines the relationship between wine consumption and whether a person...
Question One A market research company examines the relationship between wine consumption and whether a person likes to watch professional tennis on television. One hundred randomly selected people are asked whether they drink wine and whether they watch tennis. The following results are obtained: Watch tennis Do not watch tennis Totals Drink wine 16 24 40 Do not drink wine 4 56 60 Totals 20 80 100 1) What is the appropriate test for this problem? 2) Set up the...
Conduct a test at the a=0.05 level of significance by determining (a) the null and alternative...
 Conduct a test at the a=0.05 level of significance by determining (a) the null and alternative hypotheses, (b) the test statistic, and (c) the P-value. Assume the samples were obtained independently from a large population using simple random sampling. Test whether pa > P2. The sample data are x = 120, n, 251, x2 = 132 and n, -311 (a) Choose the correct null and alternative hypotheses below O A. Ho P1 =Pz versus H, PP2 OB. Ho P, =...
A random sample of 28 plastic items is obtained, and their breaking strengths are measured. The sample mean is 7.14...
 A random sample of 28 plastic items is obtained, and their breaking strengths are measured. The sample mean is 7.142 and the sample standard deviation is 0.672. Conduct a hypothesis test to assess whether there is evidence that the average breaking strength is not 7.000. a) The appropriate hypotheses are: F A. H :u=7, H u 7 B. Họ : 4 = 7, H. :+7 C. H : ä = 7, H:ā +7 D. Họ : A=7, H. : H=7.442...
A study of bone density on 5 random women at a hospital produced the following result....
 A study of bone density on 5 random women at a hospital produced the following result. Suppose a significance level of a=0.02 to perform this hypothesis test. Age 33 Bone density 340 37 335 45 330 65 325 73 310 a. Draw a scatter plot of the data. b. Calculate Test- Statistic the significance of the correlation coefficient c. State the null and alternative hypothesis? d. Calculate the p-value? e. Do you reject or fail you reject the null hypothesis?...
 Using the information obtained from the previous study about exercise, the following data was obtained for the hypothesis test: • Hou = 9.7. H.: # 9.7 • Assume the significance level is a = 0.10. • The z- test statistic is calculated as 3.03. What is the p-value and conclusion for this hypothesis test? Move the blue dot to choose the appropriate test(left, right, or two-tailed). Use the graph below to move the slider to the test statistic in order...
 The following sample data were obtained from three populations where the variances were not equal, and you wish to compare the populations. Sample 1 20 26 38 45 60 70 Sample 2 13 15 23 28 31 Sample 3 39 43 46 51 55 Click here for the Excel Data File a. State the null hypothesis. HO: H1: b. Using the 0.02 level of risk, state the decision rule. (Round your answer to 3 decimal places.) Reject HO if H>...
 The value obtained for the test statistic, z, in a one-mean 2-test is given. Whether the test is two tailed, left tailed, or right tailed is also specified. For parts (a) and (b). determine the P-value and decide whether, at the 1% significance level, the data provide sufficient evidence to reject the null hypothesis in favor of the alternative hypothesis. a. The test statistic in a two-tailed test is z= -1.42. The P-value is (Round to three cocimal places as...
 In studying the responses to a multiple-choice test question, the following sample data were obtained. At the 0.10 significance level, test the claim that the responses occur with the same frequency. Ho: The responses to the questions occur with the same frequency Ha: The responses to the questions do not occur with the same frequency C 2 Observed Expected | (O - E) Response Frequency |Frequency E 24 A B 6 C 6 25 D E 17 What is the...
 Conduct a test at the a=0.05 level of significance by determining (a) the null and alternative hypotheses, (b) the test statistic, and (c) the P-value. Assume the samples were obtained independently from a large population using simple random sampling. Test whether pa > P2. The sample data are x = 120, n, 251, x2 = 132 and n, -311 (a) Choose the correct null and alternative hypotheses below O A. Ho P1 =Pz versus H, PP2 OB. Ho P, =...
 A random sample of 28 plastic items is obtained, and their breaking strengths are measured. The sample mean is 7.142 and the sample standard deviation is 0.672. Conduct a hypothesis test to assess whether there is evidence that the average breaking strength is not 7.000. a) The appropriate hypotheses are: F A. H :u=7, H u 7 B. Họ : 4 = 7, H. :+7 C. H : ä = 7, H:ā +7 D. Họ : A=7, H. : H=7.442...
 A study of bone density on 5 random women at a hospital produced the following result. Suppose a significance level of a=0.02 to perform this hypothesis test. Age 33 Bone density 340 37 335 45 330 65 325 73 310 a. Draw a scatter plot of the data. b. Calculate Test- Statistic the significance of the correlation coefficient c. State the null and alternative hypothesis? d. Calculate the p-value? e. Do you reject or fail you reject the null hypothesis?...
Most questions answered within 3 hours.
-
Where is the error in this code sequence?
String s1 = "Hello";
String s2 = "ello";...
asked 10 months ago -
Financial data for Joel de Paris, Inc., for last year
follow:
Joel de Paris, Inc.
Balance...
asked 10 months ago -
Consider this reaction:
Al2(SO4)3 (aq)+ BaCl3
(aq) Al2Cl6 (aq)- +
3BaSO4(s) . What is the...
asked 10 months ago -
Suppose that Savneet is considering increasing her
recent random sample from 20 car rentals to 40...
asked 10 months ago -
Trucks arrive at an unloading terminal at an average rate of 120
per hour.
Trucks arrive...
asked 10 months ago -
Why are methanol and ethanol completely soluble in water while
octanol is not very little soluble....
asked 10 months ago -
A facilities manager at a university reads in a research report
that the mean amount of...
asked 10 months ago -
When the CuSO4 is rehydrated by adding water to the anhydrous
compound, is this an endothermic...
asked 10 months ago -
A ray of sunlight is passing from diamond into crown glass; the
angle of incidence is...
asked 10 months ago -
A block of mass 0.249 kg is placed on top of a light, vertical
spring of...
asked 10 months ago -
how do the kidneys compensate in the presences of acidosis
a) trigger hyperventilate
b) reserve acid...
asked 10 months ago -
Question 501 pts
The rental rate of capital to the firm increases. Which of the
following...
asked 10 months ago