Discuss the horizontal analysis in the table below, explaining why Cash and Cash equivalents have been twice in 2018 than 2017 despite cash from Operating Activities falling by almost one third. And what risks for doing that?
Horizontal Analysis of Cash Flows
|
Note |
2018 |
2017 |
||
|
Cash flows from operating activities |
£m |
£m |
% change |
|
|
Cash generated from operations |
32 |
137.5 |
200.4 |
(31.4) |
|
Finance income |
0.1 |
0.1 |
– |
|
|
Finance costs |
(11.1) |
(11.2) |
(0.9) |
|
|
Tax received/(paid) |
1.3 |
(16.3) |
(108) |
|
|
Net cash generated from operating activities |
127.8 |
173.0 |
(26.1) |
|
|
Cash flows from investing activities |
||||
|
Purchase of property, plant and equipment |
(105.3) |
(72.6) |
45.0 |
|
|
Purchase of intangible assets |
(30.7) |
(52.2) |
(41.2) |
|
|
Proceeds from the sale of property, plant and equipment |
7.1 |
– |
– |
|
|
Investment in associate |
(7.5) |
– |
– |
|
|
Net cash used in investing activities |
(136.4) |
(124.8) |
9.3 |
|
|
Cash flows from financing activities |
||||
|
Drawdown/(repayment) of revolving credit facility |
22 |
66.0 |
(25.0) |
(364.0) |
|
Dividends paid |
12 |
(35.6) |
(42.0) |
(15.2) |
|
Purchase of shares by Debenhams Retail Employment Trust 2004 |
29 |
– |
(0.8) |
(100) |
|
Finance lease payments |
(1.6) |
(1.6) |
– |
|
|
Debt amendment costs |
(0.8) |
– |
– |
|
|
Net cash generated from/(used in) financing activities |
28.0 |
(69.4) |
(140.3) |
|
|
Net increase/(decrease) in cash and cash equivalents |
19.4 |
(21.2) |
(191.5) |
|
|
Net cash and cash equivalents at beginning of financial year |
19.7 |
40.8 |
(51.7) |
|
|
Foreign exchange (losses)/gains on cash and cash equivalents |
(0.2) |
0.1 |
(300) |
|
|
Net cash and cash equivalents at end of financial year |
33 |
38.9 |
19.7 |
97.5 |


Homework Answers
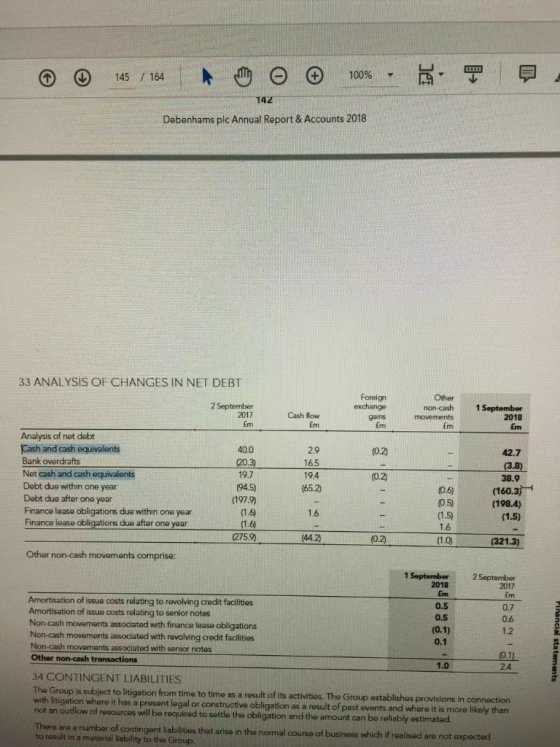
Cash and Cash equivalents have been twice in 2018 than 2017 despite cash from Operating Activities falling by almost one third. The Main Reason for the same is company has drawdown 66M from revolving credit in which company can draw further 159M as all the documents are in place and major amount of the company In this year were invested in procuring purchase of property plant & equipment & intangible assets which are of long term nature. The company has loan liability due of $165.60 Million which can be repaid from facility of 159M and rest from net proceeds of operating activities but surely company is going to face problem in 2020 as the loan become due to this year also but no major sources are available to repay the same. Either the company has to work for increasing operating Income or Arrangement of long term loan (payable from 2-5 years) / sale of plant & equipments to arrange cash flow.
Add Answer to:
Discuss the horizontal analysis in the table below, explaining
why Cash and Cash equivalents have been...
prepare a horizontal analysis of Cash Flows for 2010 and 2011 Horizontal Analysis of Cash Flows...
prepare a horizontal analysis of Cash Flows for 2010 and 2011 Horizontal Analysis of Cash Flows Note 2011 2010 Cash flows from operating activities £m £m % change Cash generated from operations 32 137.5 200.4 (31.4) Finance income 0.1 0.1 0 Finance costs (11.1) (11.2) Tax received/(paid) 1.3 (16.3) Net cash generated from operating activities 127.8 173.0 Cash flows from investing activities Purchase of property, plant and equipment (105.3) (72.6) Purchase of intangible assets (30.7) (52.2) Proceeds from the sale...
statement of Cash Flows Does the ending balance of cash and cash equivalents sh with the...
 statement of Cash Flows Does the ending balance of cash and cash equivalents sh with the amount reported on the balance sheet? agree AutoSave On Summer 2020 Finance Analysis Project - Saved - O Search Insert File Draw Data Page Layout Home Formulas Review View Help Calibri ν Α' Α' 2 Wrap Text Genera X cut [ Copy - Format Painter BIU a. Av Merge & Center $ Clipboard Font E Alignment 52 E F B cash 25,255 27,753 28,337...
Was there a net increase or decrease in cash and cash equivalents for 2018? ____________ What...
 Was there a net increase or decrease
in cash and cash equivalents for 2018? ____________
What was the amount?
____________ (remember the statement is in millions)
Apple Inc. TED STATEMENTS OF CASH FLOWS (In millions) Years endod September 29, 2018 September 30, 2017 September 24, 2016 Cash and cash equivalents, beginning of the year 21.120 Adjustments to reconcile net income to cash generated by operating activities: Deterred income tax expense/(benefit) (32,590) Changes in operating assets and liabilities Other current and...
Was there a net increase or decrease
in cash and cash equivalents for 2018? ____________
What was the amount?
____________ (remember the statement is in millions)
Apple Inc. TED STATEMENTS OF CASH FLOWS (In millions) Years endod September 29, 2018 September 30, 2017 September 24, 2016 Cash and cash equivalents, beginning of the year 21.120 Adjustments to reconcile net income to cash generated by operating activities: Deterred income tax expense/(benefit) (32,590) Changes in operating assets and liabilities Other current and...
Instead of “cash,” the company’s balance sheet uses the account name “Cash and cash equivalents.” How...
 Instead of “cash,” the company’s balance sheet uses the account
name “Cash and cash equivalents.” How does the company define cash
equivalents?
The annual report has two reports in which management is
clearly identified as having for the company’s financial reporting
and internal controls. What are the names of these reports and on
what pages are they located?
For the Fiscal Year 2017 2016 As Adjusted As Adjusted 71,786 $ 69,414 $ 72,714 70,271 2014 2018 74,433 $ 75,356 $...
Instead of “cash,” the company’s balance sheet uses the account
name “Cash and cash equivalents.” How does the company define cash
equivalents?
The annual report has two reports in which management is
clearly identified as having for the company’s financial reporting
and internal controls. What are the names of these reports and on
what pages are they located?
For the Fiscal Year 2017 2016 As Adjusted As Adjusted 71,786 $ 69,414 $ 72,714 70,271 2014 2018 74,433 $ 75,356 $...
February 3, 2018 January 28, 2017 ASSETS $ CURRENT ASSETS: Cash and cash equivalents Short-term investments...
 February 3, 2018 January 28, 2017 ASSETS $ CURRENT ASSETS: Cash and cash equivalents Short-term investments (Notes B and C) Receivables Inventory Prepaid expenses and other assets (Note F) Total current assets 165,086 50,833 8,588 118,007 18,070 360,584 196,536 49,994 8,210 125,694 6,023 386,457 PROPERTY AND EQUIPMENT (Note D) Less accumulated depreciation and amortization 459,043 (309,497) 149,546 459,359 (290,364) 168,995 LONG-TERM INVESTMENTS (Notes B and C) OTHER ASSETS (Notes F and G) 21,453 6,533 18,092 6,303 Total assets $ 538,116...
Locate the financial statement that reveals to the reader Target's debt balances at fiscal year-end February...
 Locate the financial statement that reveals to the reader Target's debt balances at fiscal year-end February 1, 2020. Questions: What is the name of that statement? What dollar amount does Target specifically report (i.e. label) as “long-term debt and other borrowings" for February 1, 2020? What total dollar amount does Target report as long-term debt for the fiscal year ending February 1, 2020? What percent of Target's total assets are financed with debt and what percent of Target's total assets...
To complete the assignment, you will be using financial statement excerpts from the 2018 10Ks of...
 To complete the assignment, you will be using financial
statement excerpts from the 2018 10Ks of Delta, Honeywell, and Ford
Motor Company. I have extracted the portions of the 10K you will
require for the assignment and posted the information
6. What is the funded status of all of Honeywell’s pension
benefit plans in 2018 (US and Non US)? What amount of asset or
liability should Honeywell report on its 2018 balance sheet?
Excerpt from Ford Motor Company 2018 10K...
To complete the assignment, you will be using financial
statement excerpts from the 2018 10Ks of Delta, Honeywell, and Ford
Motor Company. I have extracted the portions of the 10K you will
require for the assignment and posted the information
6. What is the funded status of all of Honeywell’s pension
benefit plans in 2018 (US and Non US)? What amount of asset or
liability should Honeywell report on its 2018 balance sheet?
Excerpt from Ford Motor Company 2018 10K...
Perform a financial analysis for Under Armor using the financial statements below. Using 3 years of...
 Perform a financial analysis for Under Armor using the financial
statements below. Using 3 years of data, compare the data to the
industry average in order to determine how the company is doing.
Please include the following ratios: Gross profit margin, ROI, ROE,
EPS, Inventory turnover, days of inventory, debt to asset ratio,
debt to equity ratio, times interest earned
THANK YOU!!!
December 31, 2009 December 31, 2006 December 31, 2007 $187.297 79356 148.888 19,989 12,870 448.000 72,926 5.681 13,908...
Perform a financial analysis for Under Armor using the financial
statements below. Using 3 years of data, compare the data to the
industry average in order to determine how the company is doing.
Please include the following ratios: Gross profit margin, ROI, ROE,
EPS, Inventory turnover, days of inventory, debt to asset ratio,
debt to equity ratio, times interest earned
THANK YOU!!!
December 31, 2009 December 31, 2006 December 31, 2007 $187.297 79356 148.888 19,989 12,870 448.000 72,926 5.681 13,908...
P12.35 Integrative Case Analysis. CSK Auto Corp. is the largest retailer of automotive parts and accessories...
 P12.35 Integrative Case Analysis. CSK Auto Corp. is the largest retailer of automotive parts and accessories in the Western United States and one of the largest retailers of such products in the United States based on the number of stores. As of February 4, 2001, the company operated 1,152 stores as one fully integrated company under three brand names: Checker Auto Parts, Schuck's Auto Supply, and Kragen Auto Parts. Presented below is selected information from CSK Auto Corp.'s 2001 10-K...
The following infomation has been extracted from the financial statements of Jones Led on 30/4/2019. Income...
 The following infomation has been extracted from the financial statements of Jones Led on 30/4/2019. Income Statement of Jones Ltd for the year-ending 30 April 2019 Em 587 Sales tumover Cost of goods sold Gross Profil Distribution costs Administrative COSES Operating profil Interest Profit before tax Taxation Profit after tax Dividends Retained Profit for the year Statement of Financial Position of Jones Ltd as at 30 April 2019 2018 sma Tangible non-current assets Current assets: Inventory Trade Receivables Prepaid expenses...
 statement of Cash Flows Does the ending balance of cash and cash equivalents sh with the amount reported on the balance sheet? agree AutoSave On Summer 2020 Finance Analysis Project - Saved - O Search Insert File Draw Data Page Layout Home Formulas Review View Help Calibri ν Α' Α' 2 Wrap Text Genera X cut [ Copy - Format Painter BIU a. Av Merge & Center $ Clipboard Font E Alignment 52 E F B cash 25,255 27,753 28,337...
 Was there a net increase or decrease
in cash and cash equivalents for 2018? ____________
What was the amount?
____________ (remember the statement is in millions)
Apple Inc. TED STATEMENTS OF CASH FLOWS (In millions) Years endod September 29, 2018 September 30, 2017 September 24, 2016 Cash and cash equivalents, beginning of the year 21.120 Adjustments to reconcile net income to cash generated by operating activities: Deterred income tax expense/(benefit) (32,590) Changes in operating assets and liabilities Other current and...
Was there a net increase or decrease
in cash and cash equivalents for 2018? ____________
What was the amount?
____________ (remember the statement is in millions)
Apple Inc. TED STATEMENTS OF CASH FLOWS (In millions) Years endod September 29, 2018 September 30, 2017 September 24, 2016 Cash and cash equivalents, beginning of the year 21.120 Adjustments to reconcile net income to cash generated by operating activities: Deterred income tax expense/(benefit) (32,590) Changes in operating assets and liabilities Other current and...
 Instead of “cash,” the company’s balance sheet uses the account
name “Cash and cash equivalents.” How does the company define cash
equivalents?
The annual report has two reports in which management is
clearly identified as having for the company’s financial reporting
and internal controls. What are the names of these reports and on
what pages are they located?
For the Fiscal Year 2017 2016 As Adjusted As Adjusted 71,786 $ 69,414 $ 72,714 70,271 2014 2018 74,433 $ 75,356 $...
Instead of “cash,” the company’s balance sheet uses the account
name “Cash and cash equivalents.” How does the company define cash
equivalents?
The annual report has two reports in which management is
clearly identified as having for the company’s financial reporting
and internal controls. What are the names of these reports and on
what pages are they located?
For the Fiscal Year 2017 2016 As Adjusted As Adjusted 71,786 $ 69,414 $ 72,714 70,271 2014 2018 74,433 $ 75,356 $...
 February 3, 2018 January 28, 2017 ASSETS $ CURRENT ASSETS: Cash and cash equivalents Short-term investments (Notes B and C) Receivables Inventory Prepaid expenses and other assets (Note F) Total current assets 165,086 50,833 8,588 118,007 18,070 360,584 196,536 49,994 8,210 125,694 6,023 386,457 PROPERTY AND EQUIPMENT (Note D) Less accumulated depreciation and amortization 459,043 (309,497) 149,546 459,359 (290,364) 168,995 LONG-TERM INVESTMENTS (Notes B and C) OTHER ASSETS (Notes F and G) 21,453 6,533 18,092 6,303 Total assets $ 538,116...
 Locate the financial statement that reveals to the reader Target's debt balances at fiscal year-end February 1, 2020. Questions: What is the name of that statement? What dollar amount does Target specifically report (i.e. label) as “long-term debt and other borrowings" for February 1, 2020? What total dollar amount does Target report as long-term debt for the fiscal year ending February 1, 2020? What percent of Target's total assets are financed with debt and what percent of Target's total assets...
 To complete the assignment, you will be using financial
statement excerpts from the 2018 10Ks of Delta, Honeywell, and Ford
Motor Company. I have extracted the portions of the 10K you will
require for the assignment and posted the information
6. What is the funded status of all of Honeywell’s pension
benefit plans in 2018 (US and Non US)? What amount of asset or
liability should Honeywell report on its 2018 balance sheet?
Excerpt from Ford Motor Company 2018 10K...
To complete the assignment, you will be using financial
statement excerpts from the 2018 10Ks of Delta, Honeywell, and Ford
Motor Company. I have extracted the portions of the 10K you will
require for the assignment and posted the information
6. What is the funded status of all of Honeywell’s pension
benefit plans in 2018 (US and Non US)? What amount of asset or
liability should Honeywell report on its 2018 balance sheet?
Excerpt from Ford Motor Company 2018 10K...
 Perform a financial analysis for Under Armor using the financial
statements below. Using 3 years of data, compare the data to the
industry average in order to determine how the company is doing.
Please include the following ratios: Gross profit margin, ROI, ROE,
EPS, Inventory turnover, days of inventory, debt to asset ratio,
debt to equity ratio, times interest earned
THANK YOU!!!
December 31, 2009 December 31, 2006 December 31, 2007 $187.297 79356 148.888 19,989 12,870 448.000 72,926 5.681 13,908...
Perform a financial analysis for Under Armor using the financial
statements below. Using 3 years of data, compare the data to the
industry average in order to determine how the company is doing.
Please include the following ratios: Gross profit margin, ROI, ROE,
EPS, Inventory turnover, days of inventory, debt to asset ratio,
debt to equity ratio, times interest earned
THANK YOU!!!
December 31, 2009 December 31, 2006 December 31, 2007 $187.297 79356 148.888 19,989 12,870 448.000 72,926 5.681 13,908...
 P12.35 Integrative Case Analysis. CSK Auto Corp. is the largest retailer of automotive parts and accessories in the Western United States and one of the largest retailers of such products in the United States based on the number of stores. As of February 4, 2001, the company operated 1,152 stores as one fully integrated company under three brand names: Checker Auto Parts, Schuck's Auto Supply, and Kragen Auto Parts. Presented below is selected information from CSK Auto Corp.'s 2001 10-K...
 The following infomation has been extracted from the financial statements of Jones Led on 30/4/2019. Income Statement of Jones Ltd for the year-ending 30 April 2019 Em 587 Sales tumover Cost of goods sold Gross Profil Distribution costs Administrative COSES Operating profil Interest Profit before tax Taxation Profit after tax Dividends Retained Profit for the year Statement of Financial Position of Jones Ltd as at 30 April 2019 2018 sma Tangible non-current assets Current assets: Inventory Trade Receivables Prepaid expenses...
Most questions answered within 3 hours.
-
Where is the error in this code sequence?
String s1 = "Hello";
String s2 = "ello";...
asked 11 months ago -
Financial data for Joel de Paris, Inc., for last year
follow:
Joel de Paris, Inc.
Balance...
asked 11 months ago -
Consider this reaction:
Al2(SO4)3 (aq)+ BaCl3
(aq) Al2Cl6 (aq)- +
3BaSO4(s) . What is the...
asked 11 months ago -
Suppose that Savneet is considering increasing her
recent random sample from 20 car rentals to 40...
asked 11 months ago -
Trucks arrive at an unloading terminal at an average rate of 120
per hour.
Trucks arrive...
asked 11 months ago -
Why are methanol and ethanol completely soluble in water while
octanol is not very little soluble....
asked 11 months ago -
A facilities manager at a university reads in a research report
that the mean amount of...
asked 11 months ago -
When the CuSO4 is rehydrated by adding water to the anhydrous
compound, is this an endothermic...
asked 11 months ago -
A ray of sunlight is passing from diamond into crown glass; the
angle of incidence is...
asked 11 months ago -
A block of mass 0.249 kg is placed on top of a light, vertical
spring of...
asked 11 months ago -
how do the kidneys compensate in the presences of acidosis
a) trigger hyperventilate
b) reserve acid...
asked 11 months ago -
Question 501 pts
The rental rate of capital to the firm increases. Which of the
following...
asked 11 months ago